Packetriot Daemon
This release introduces a new mode of operation called daemon mode. As the name suggests, for those familiar with Unix/Linux, a daemon is a process that runs in the background all the time. For the Packetriot client to function in this manner and remain uninterrupted, we needed to add a web-based dashboard or API to manage it.
Currently, the Packetriot client needs to be restarted between making traffic rule changes or allocating TCP ports. Daemon mode enables users to use their web browser or API to configure a tunnel from scratch and then set up traffic rules.
Running the pktriot as a daemon is simple, we added a new sub-command called daemon
[user@host ] pktriot daemon
Running the Packetriot client in daemon mode enables a web-based UI for managing the entire life-cycle of the client and tunnel. It also provides HTTP API endpoints as well. The endpoints for both of these services is:
- Dashboard -
https://127.0.0.1:4100 - API -
https://127.0.0.1:4100/api/client/v1.0/
The dashboard and API are both served over HTTPS and use a self-signed certificate. The dashboard and API providing the following capabilites:
- Configure a new tunnel
- Toggle the tunnel on and off
- Manage traffic rules and port allocations
- Manage your custom domains and reserved subdomains
- Change settings such as the tunnel name, reconnect intervals, networking, and uptime monitoring
- Download the tunnel configuration for easy backups
- Change security settings such as dashboard password and API token.
- Terminate the tunnel
The sections below will describe the different methods to deploy the Packetriot client in dameon mode. We'll also review the web-based dashboard and walk-through some of its major areas and the tunnel configuration workflow.
Configuration
Docker
For those using Docker to run the pktriot client, we've updated our Dockerfile in v0.16.0 and later to set the ENTRYPOINT as /usr/bin/pktriot --config /data/config.json and the CMD as daemon --dashboard-address 0.0.0.0.
Here's an example command to run the container.
[user@host ] mkdir -p ./pktriot-data
[user@host ] docker run -d --restart unless-stopped -v ./pktriot-data:/data -p 4100:4100 --name pktriot packetriot/pktriot:latest
An example compose file.
services:
  pktriotd:
    image: packetriot/pktriot:latest
    container_name: pktriot
    restart: unless-stopped
    volumes:
      - ./pktriot-data:/data
    ports:
      - 4100:4100
By default, the listening address for the dashboard and API is 127.0.0.1, however, you may want to use a specific address or listen on all addresse 0.0.0.0.
Using 0.0.0.0 is recommended for running the pktriot daemon in a container since it's behind a privately NAT'd virtual network. If you're running the container using host networking, then you can use the default 127.0.0.1 or specify a non-local IP address that the host uses.
Linux
We updated the systemd service unit for Linux to run the daemon sub-command by default. Earlier our service unit executed the start sub-command.
If you want to revert it so that the start command is used, you can run this command: sudo systemctl edit pktriot and then make these changes:
[Service]
ExecStart=/usr/bin/pktriot --config /etc/pktriot/config.json start
This will customize the service unit and persist between upgrades to the pktriot client.
To run the Packetriot client as a service using systemd just run the command:
[user@host ] sudo systemctl enable --now pktriot
This command will enable the systemd service unit for the Packetriot client and start it up immediately. Visit https://127.0.0.1:4100 in your favorite browser and begin configuration your tunnel.
Windows
We updated our Windows service support starting in v0.16.0 to run the Packetriot client using the daemon sub-command by default. However, this is configurable and we'll show you the steps below.
Once you download the zip archive for the Windows distribution of the client, extract it and place the pktriot.exe binary in a location of your choosing, e.g. C:\Packetriot. Once that's done run cmd or powershell as an administrator. Then use these commands to install a Windows service to run the client in daemon mode.
# by default it will run the client in daemon mode
C:\Packetriot> pktriot.exe windows install

# need to run the windows service using "start", do this:
C:\Packetriot> pktriot.exe windows install --daemon=false
The Windows service will be install. Open up the Services application and look the Packetriot service. Start the service and visit https://127.0.0.1:4100 to configure the client.
macOS
MacOS provides a service called launchd which is similar to systemd on Linux. Our macOS distribution includes a file named pktriot.plist that can be used a baseline to setting up the Packetriot client as a service running in daemon mode.
Extract the macOS taeball and copy the pktriot binary to a place on your system, e.g. /usr/loca/bin. You should first run the pktriot version on the system which should fail. This is because macOS by default doesn't run applications that are not signed.
You can visit the Security section in the Settings application to then allow pktriot to be executed from that point on. Run pktriot version one more time to verify that it is executing correctly.
Included in the tarball is a file named pktriot.plist. Custom this file to utilize the path you placed the pktriot binary in, and then copy it to /Users/<username>/Library/LaunchAgents. You can now start the Packetriot daemon with this command.
[user@host ] launchctl load ~/Library/LaunchAgents/pktriot.plist
The daemon will start up. Visit https://127.0.0.1:4100 in your favorite browser to configure the client with the dashboard.
Dashboard
The web dashboard streamlines the creation and management of tunnels. It also enables the management of custom domains and reserved subdomains within the client. You can now manage all features available in Packetriot, as well as a specific tunnel, in one place.
The dashboard supports configuring tunnels with your Packetriot account, with self-hosting instances of the Spokes server, or importing a configuration from a previously created tunnel.
We'll do a quick review and walkthrough of how the dashboard works.
Configure
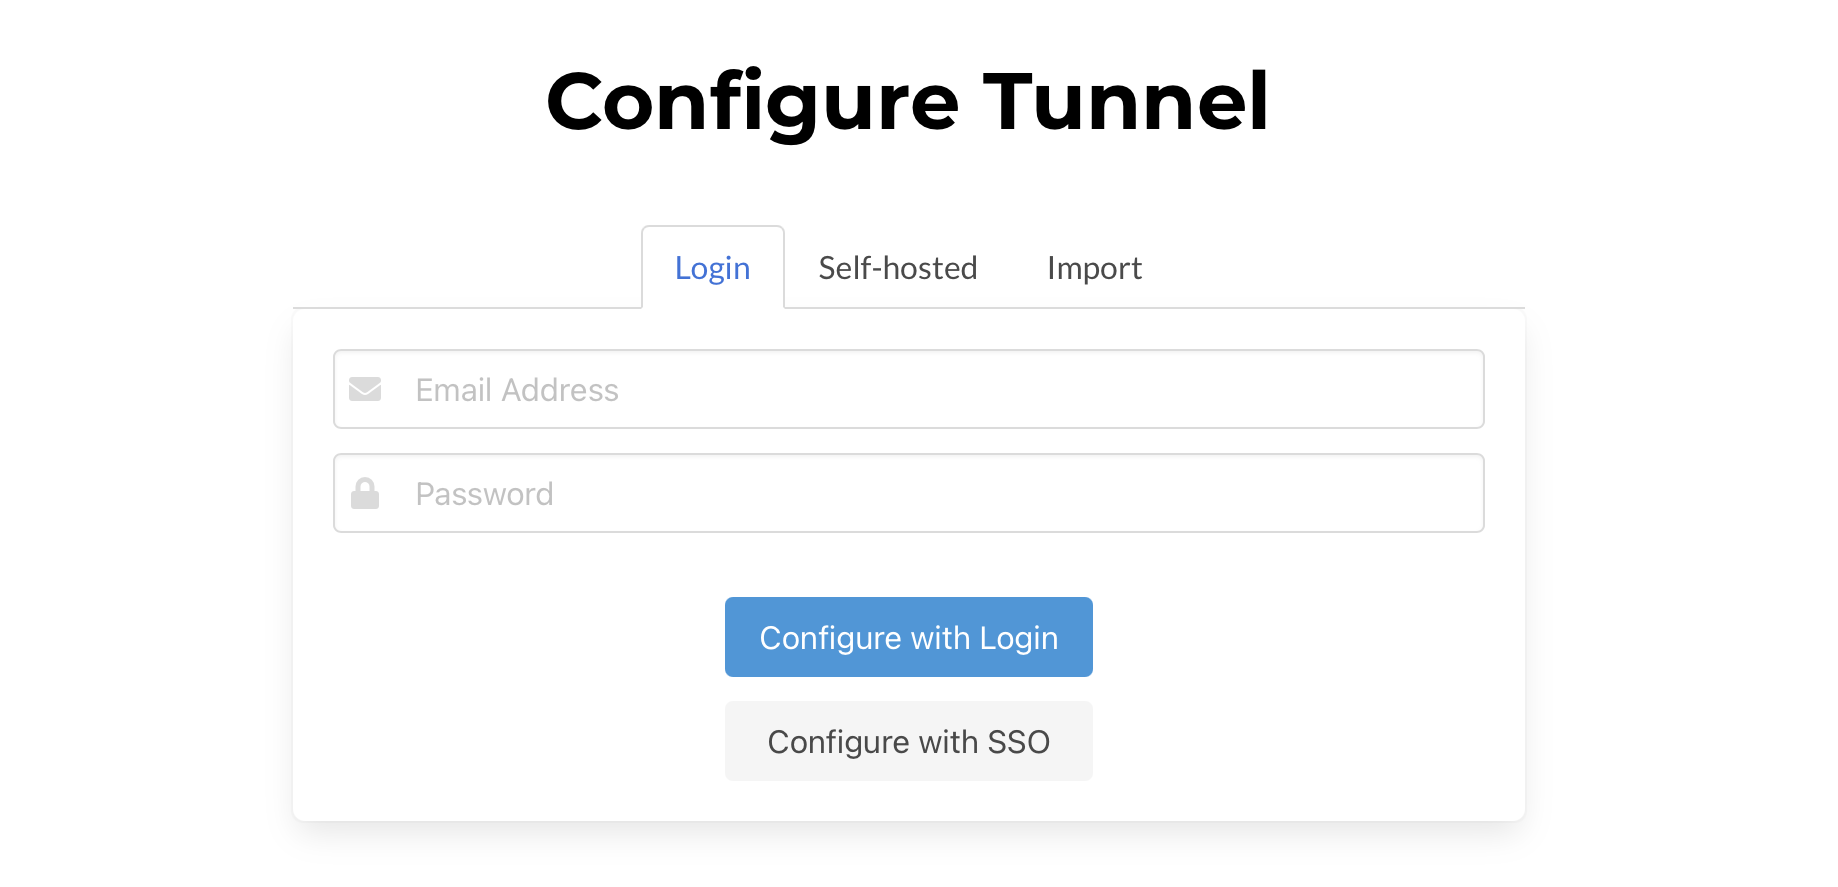
When you visit the web dashboard for the first time, https://127.0.0.1:4100, for the first time, you will find options to use:
- Packetriot login credentials
- Single-sign on using your Google Account (if that is how you created your Packetriot account)
- Configure a tunnel on a self-hosted Spokes instance (or fully managed)
- Importing a tunnel configuration from a backup
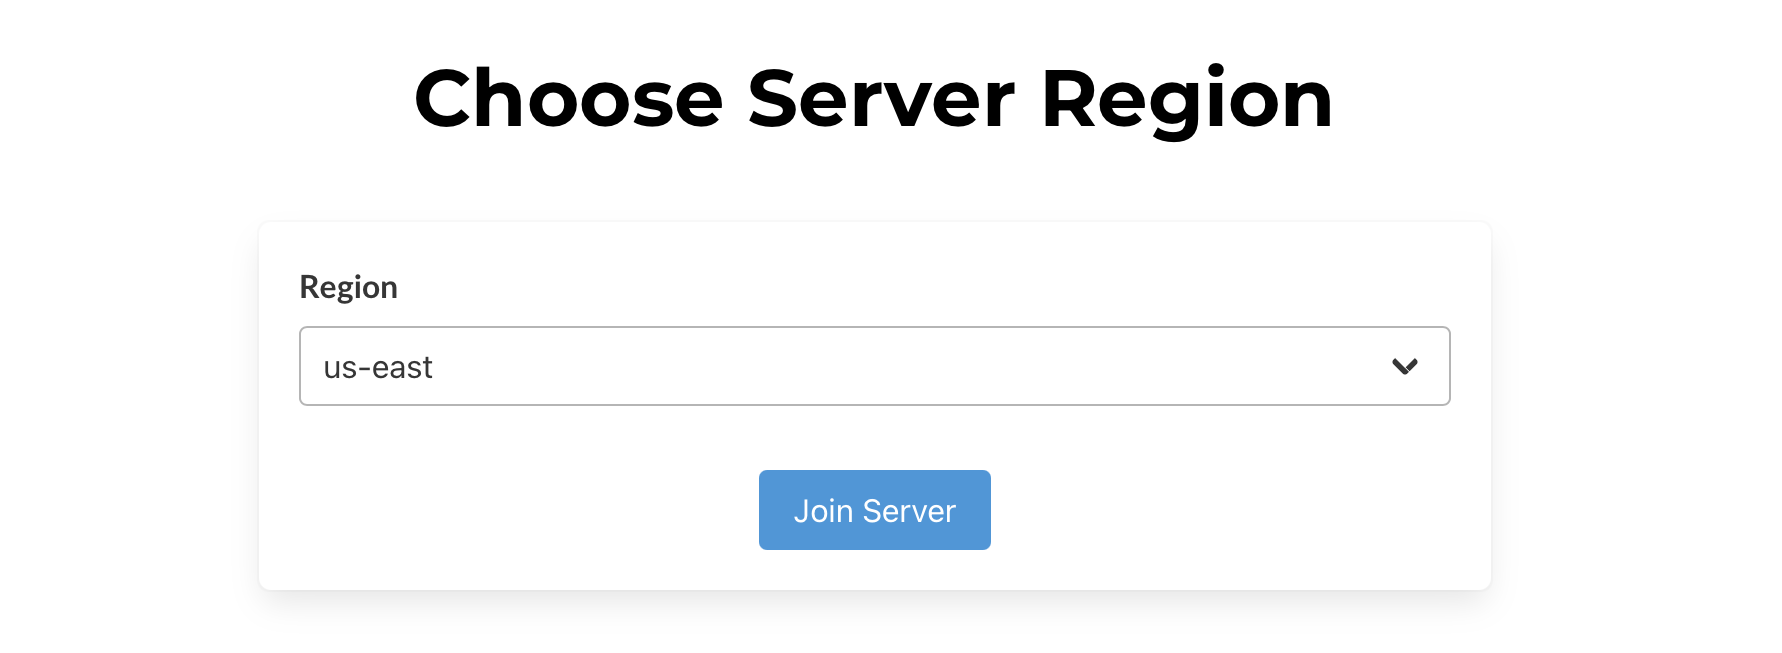
When you configure a tunnel with the Packetriot network, you will be asked to choose a region, similar to the command-line interface pktriot configure.
After configuring a tunnel, you'll be presented with a page to set up a password to log in and use the web dashboard. We recommend you set up a password.
You can also set up an API token. This API token is used to authenticate all calls to the client API. The API token is used by adding the header field X-API-Key: <token value> to your HTTPS requests.
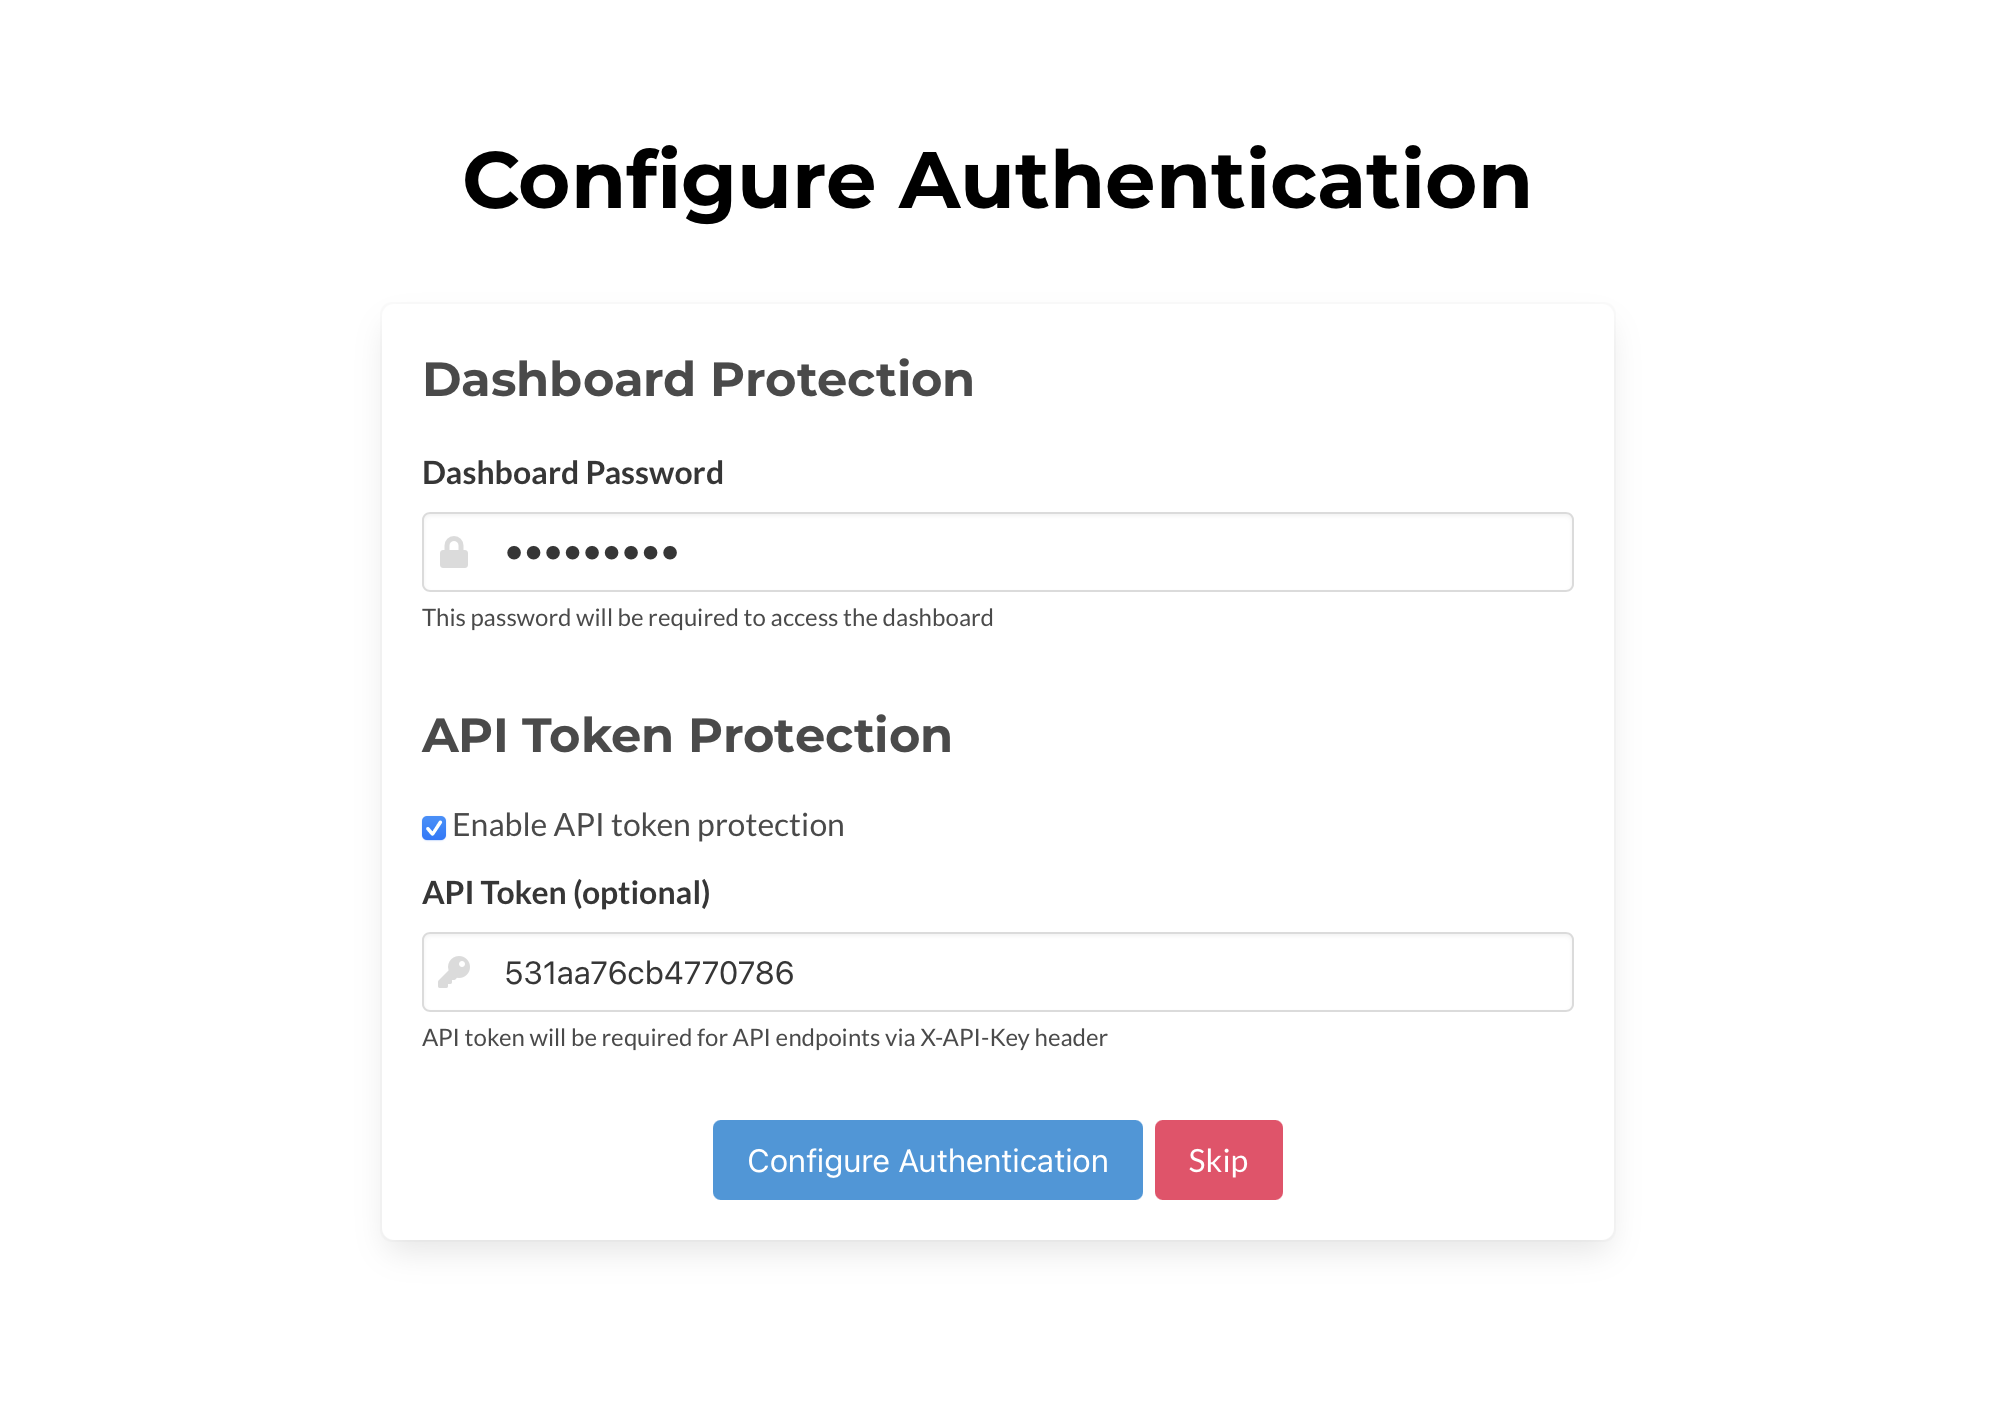
You can clear or reset these values in the Security settings page of the web dashboard in the future. You can skip this step, but we recommend you protect your Packetriot client, especially if you're hosting it using the 0.0.0.0 address.
Configure w/Spokes
You can configure the client to create a tunnel on a Spokes server if you are running a self-hosted instance or use a managed private instance operated by the Packetriot them.
To configure a client with Spokes you'll need to input:
* Registration Token
* Hostname for the Spokes instance, e.g. spokes.domain.com
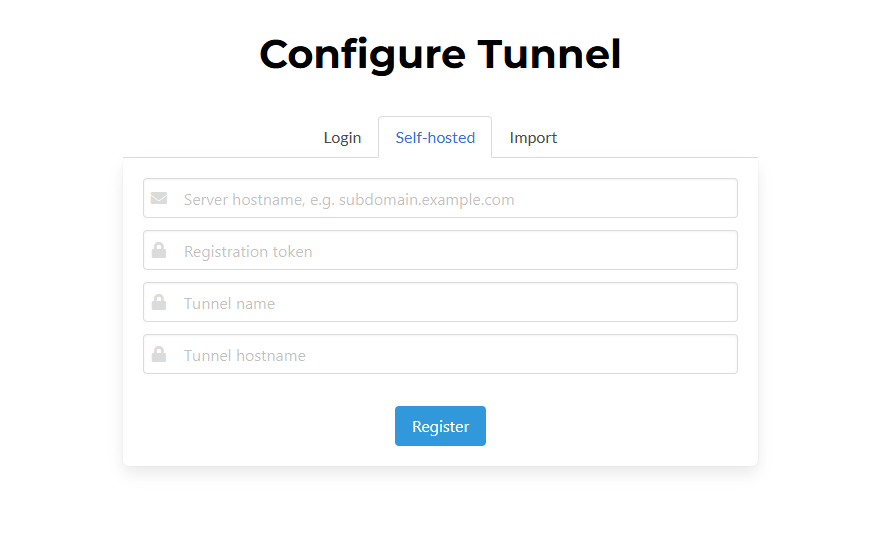
You can optionally include a name for the tunnel or customize the hostname assigned to the tunnel, override any hostname automatically generated by the Spokes server. Like the previous configuration method, you will be prompted to add a passphrase to protect the web dashboard and API.
Login
After configuring a tunnel, or importing a past configuration, you'll be prompted for a passphrase if you set one up.
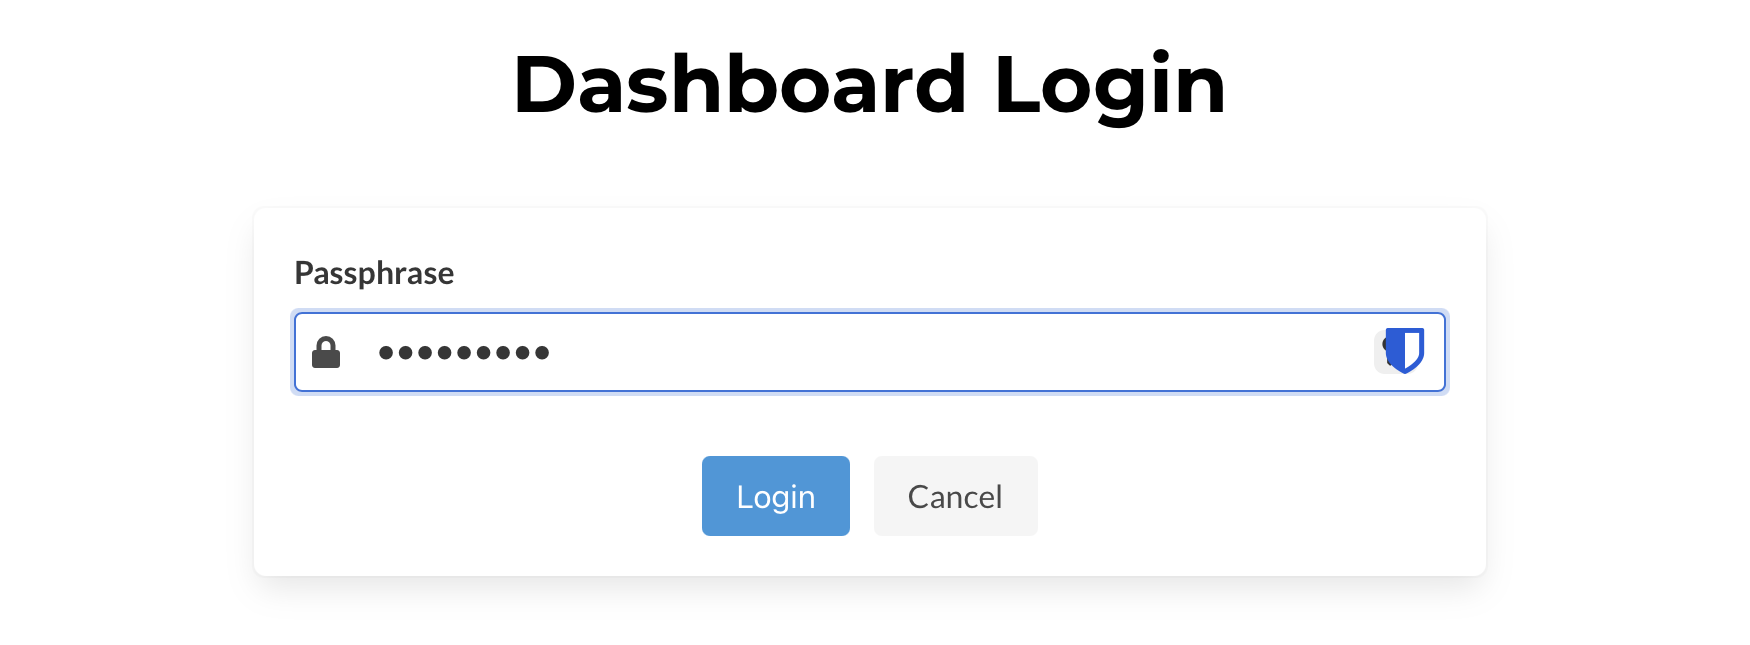
We'll repeat it... we really recommend setting up a password for the dashboard.
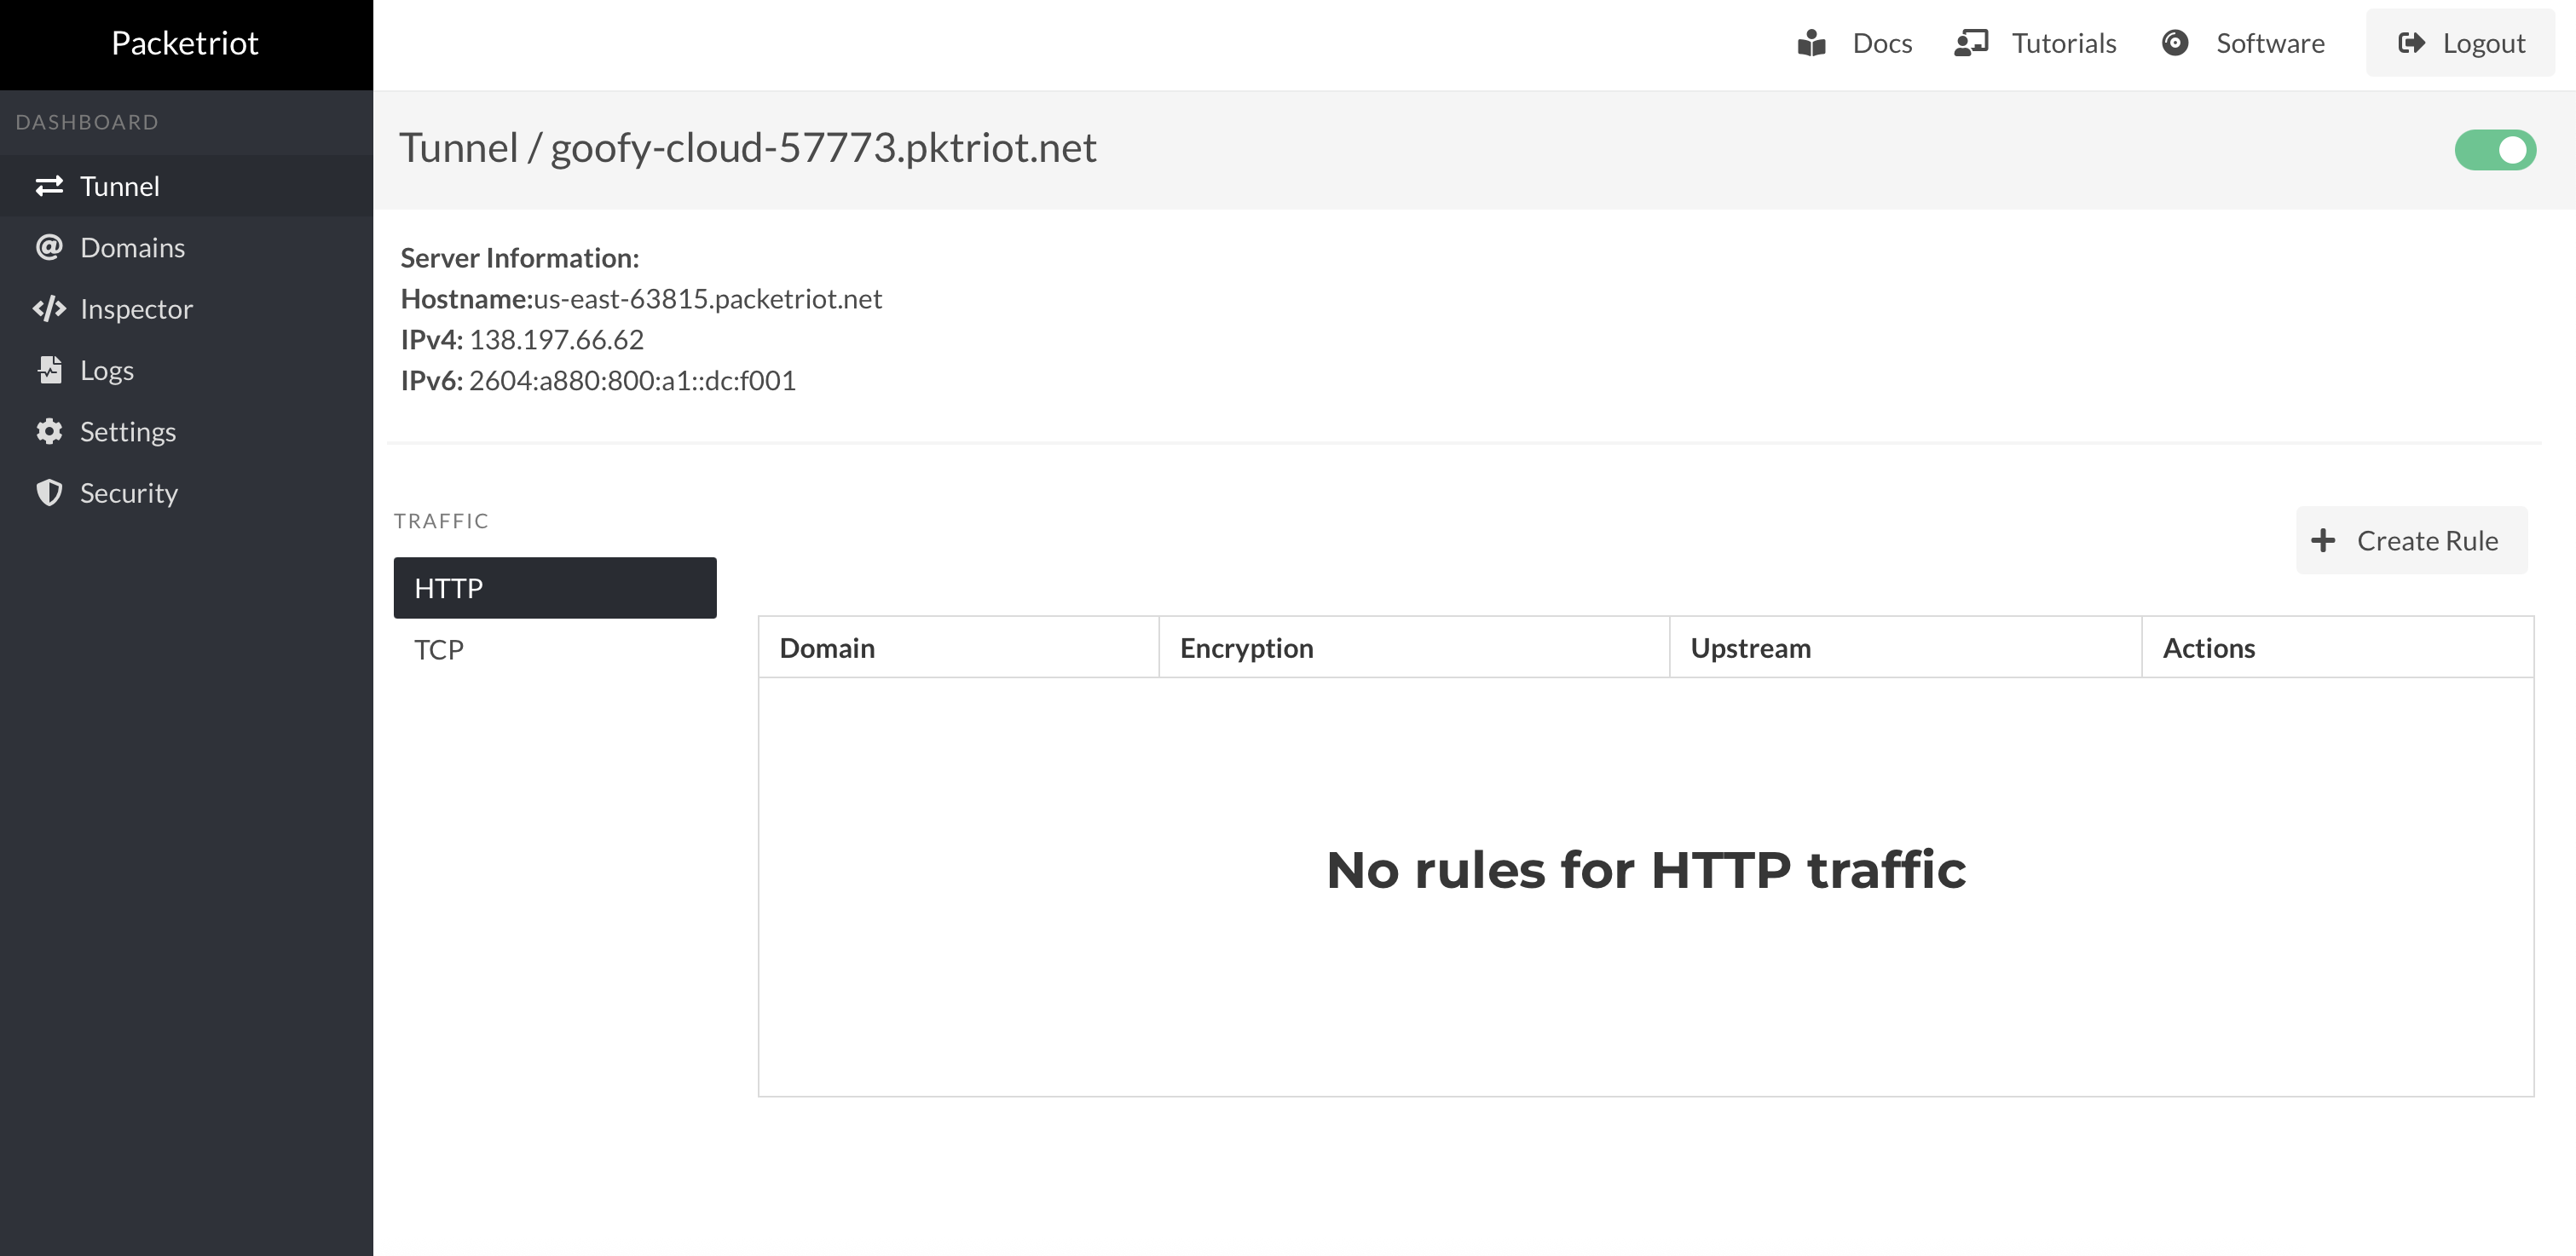
Main Dashboard
Once authenticated, you'll be presented with the main dashboard for the Packetriot client. In the top-right-hand side, you'll find a toggle button to connect or disconnect the tunnel to the assigned server. In this page, you'll discover sub-areas to manage HTTP and TCP traffic rules.
Click on HTTP or TCP to manage rules and allocate ports. We've designed forms for both traffic types to simplify how to set up traffic rules.
Custom Domains
Managing custom domains is possible with the web dashboard in the Packetriot client. Click on the Verify Domain button to specify a domain you own. It will communicate with the Packetriot to create a DNS challenge.
Follow the exact instructions documented here. You don't need to log into the main Packetriot dashboard to set up custom domains.
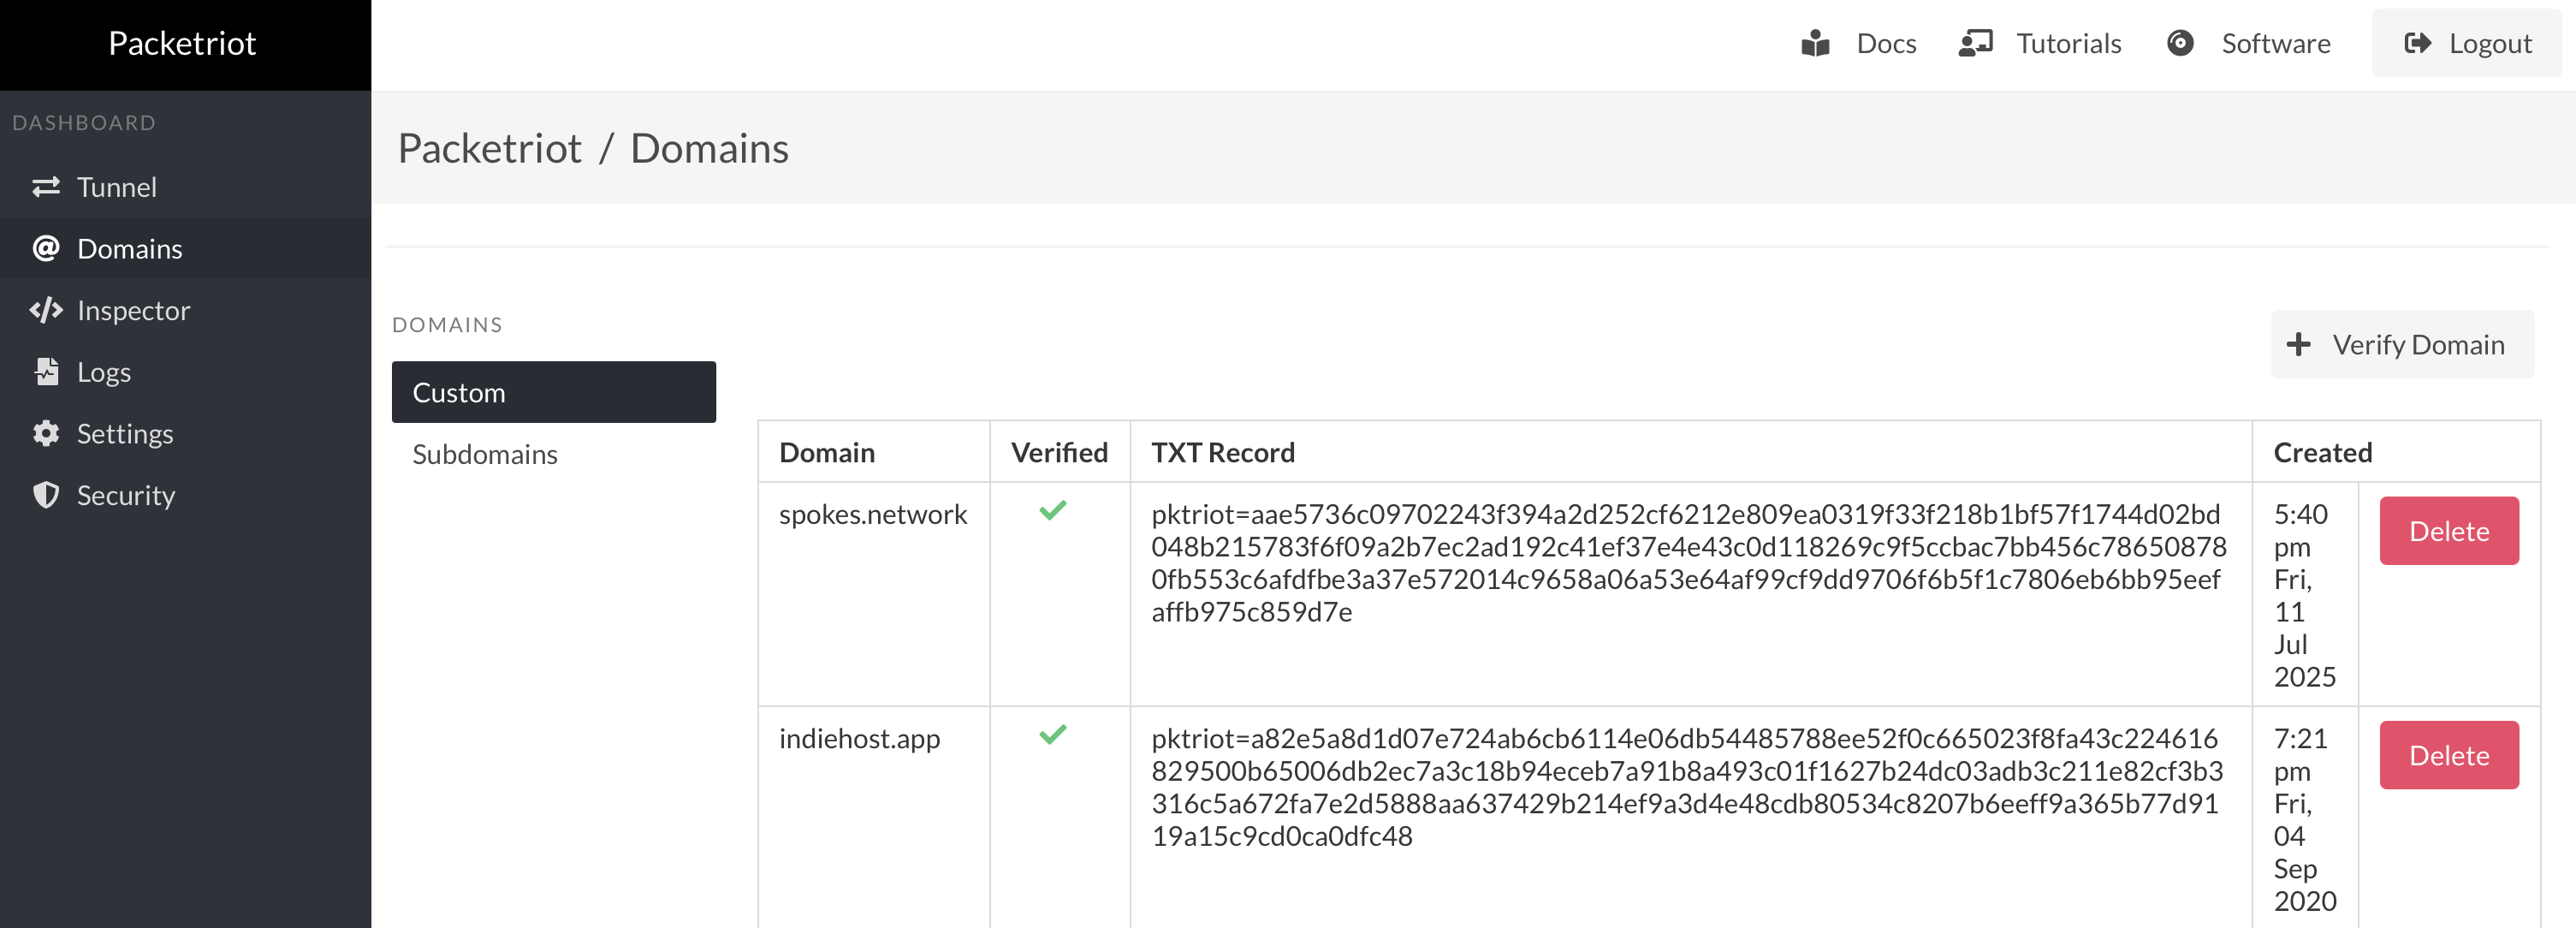
Once you follow the instructions to create the DNS TXT records to verify ownership of domains, it will show up as verified on this page.
Custom domains can be used on the free tier and by subscribers.
Subdomains
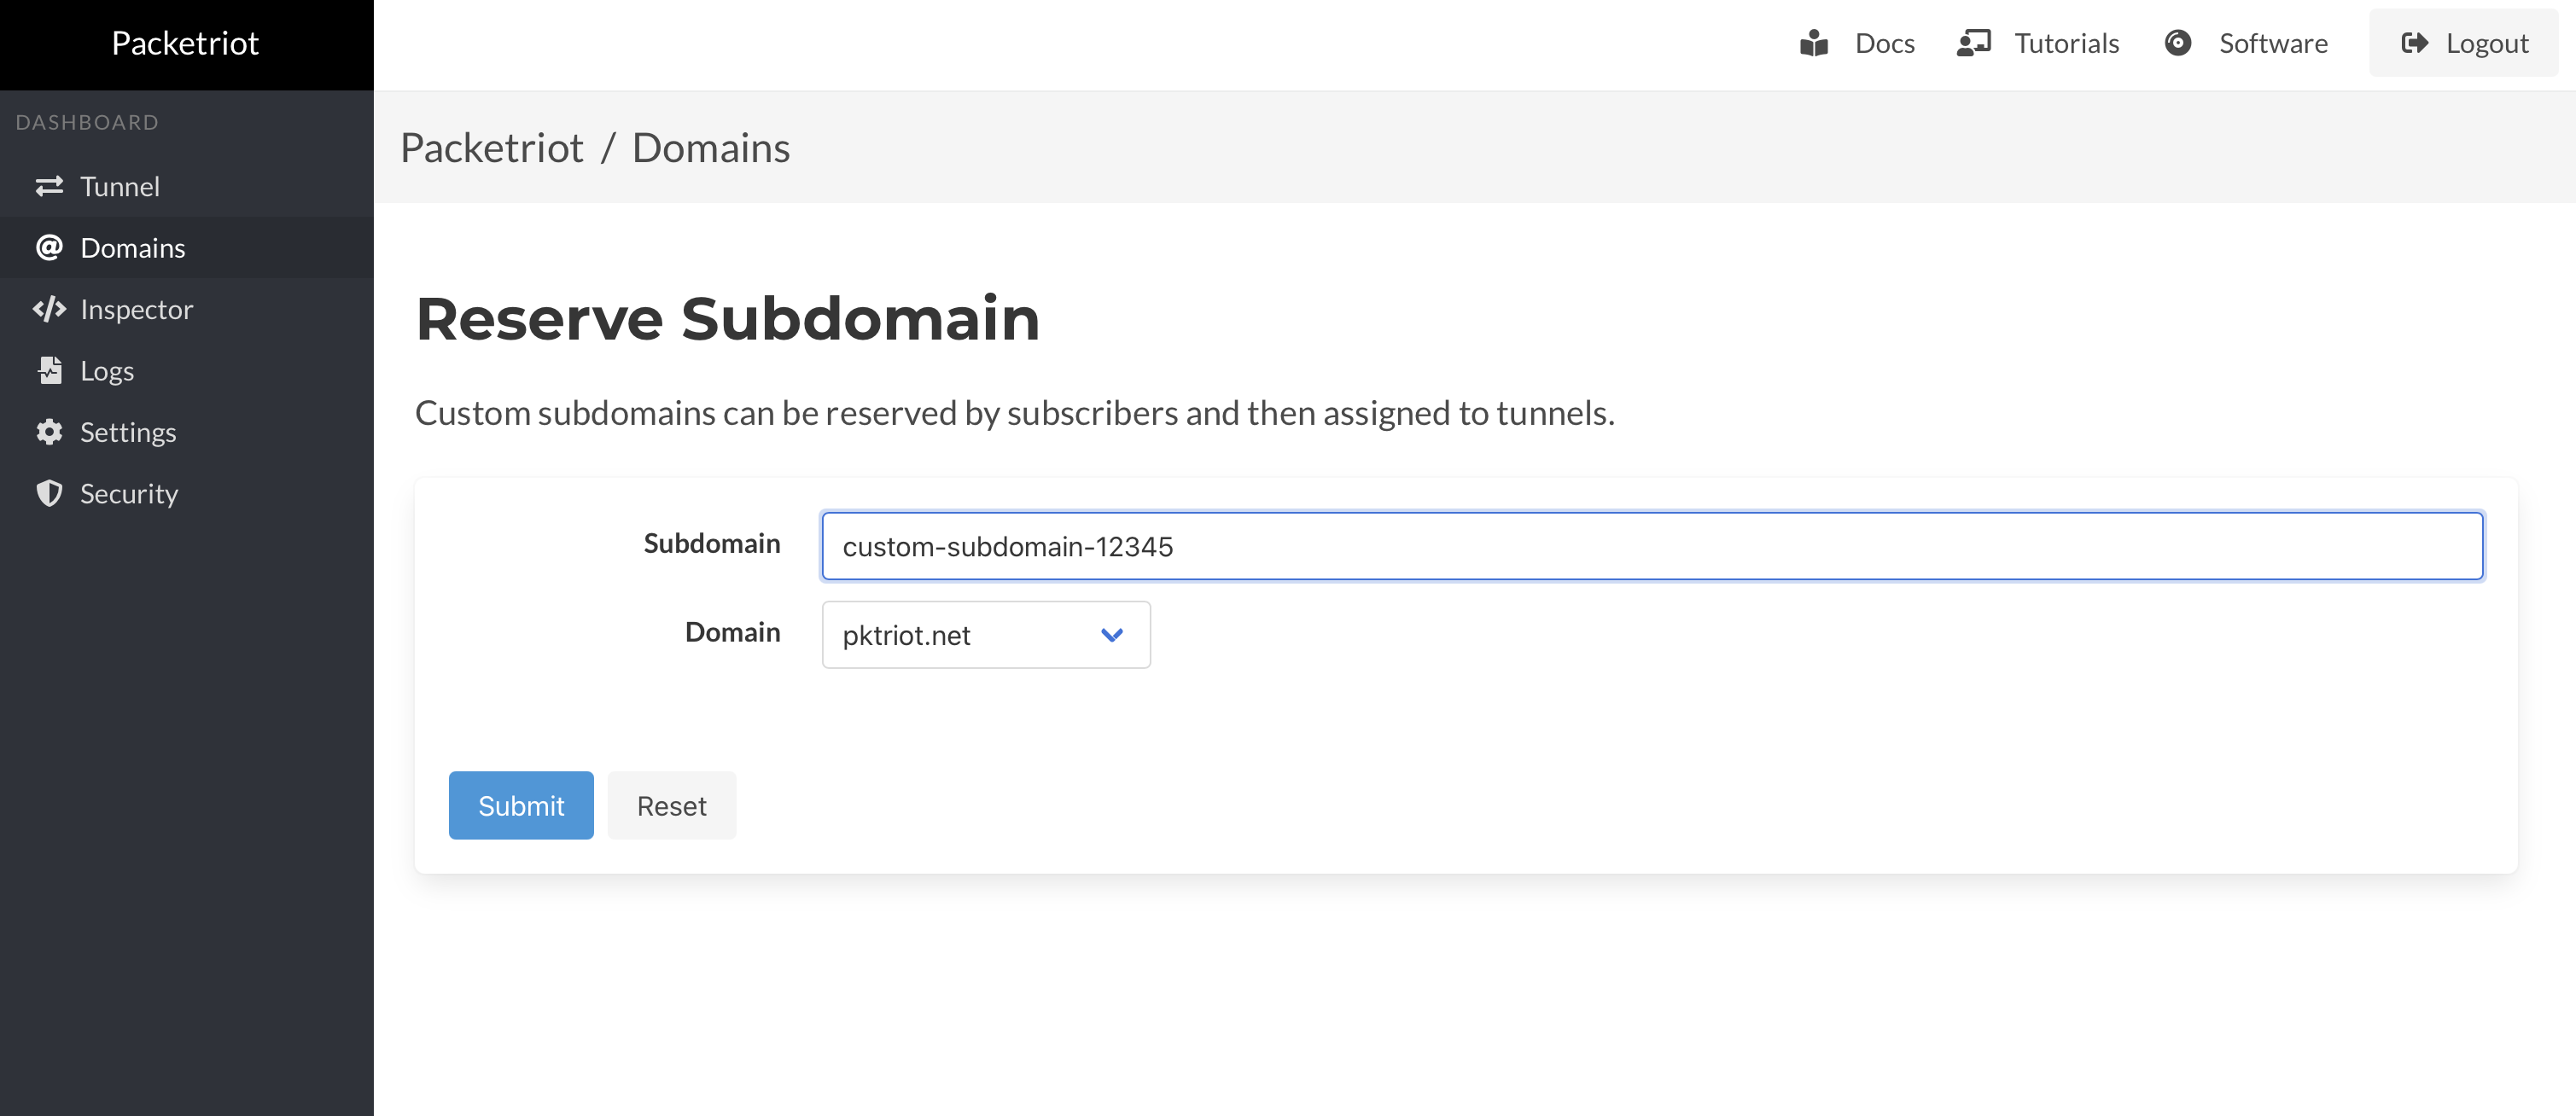
Subscribers can reserve subdomains with a customized name and assign them to tunnels. This feature allows users to reserve a tunnel hostname that persists beyond the lifespan of a tunnel and is very useful if you want to host a long-running service.
Earlier, all management for reserved subdomains had to be performed in the portal on Packetriot.com, which would mean more windows/tabs and steps to reserve and then assign a subdomain to a tunnel. Now you can do it all using the web dashboard.
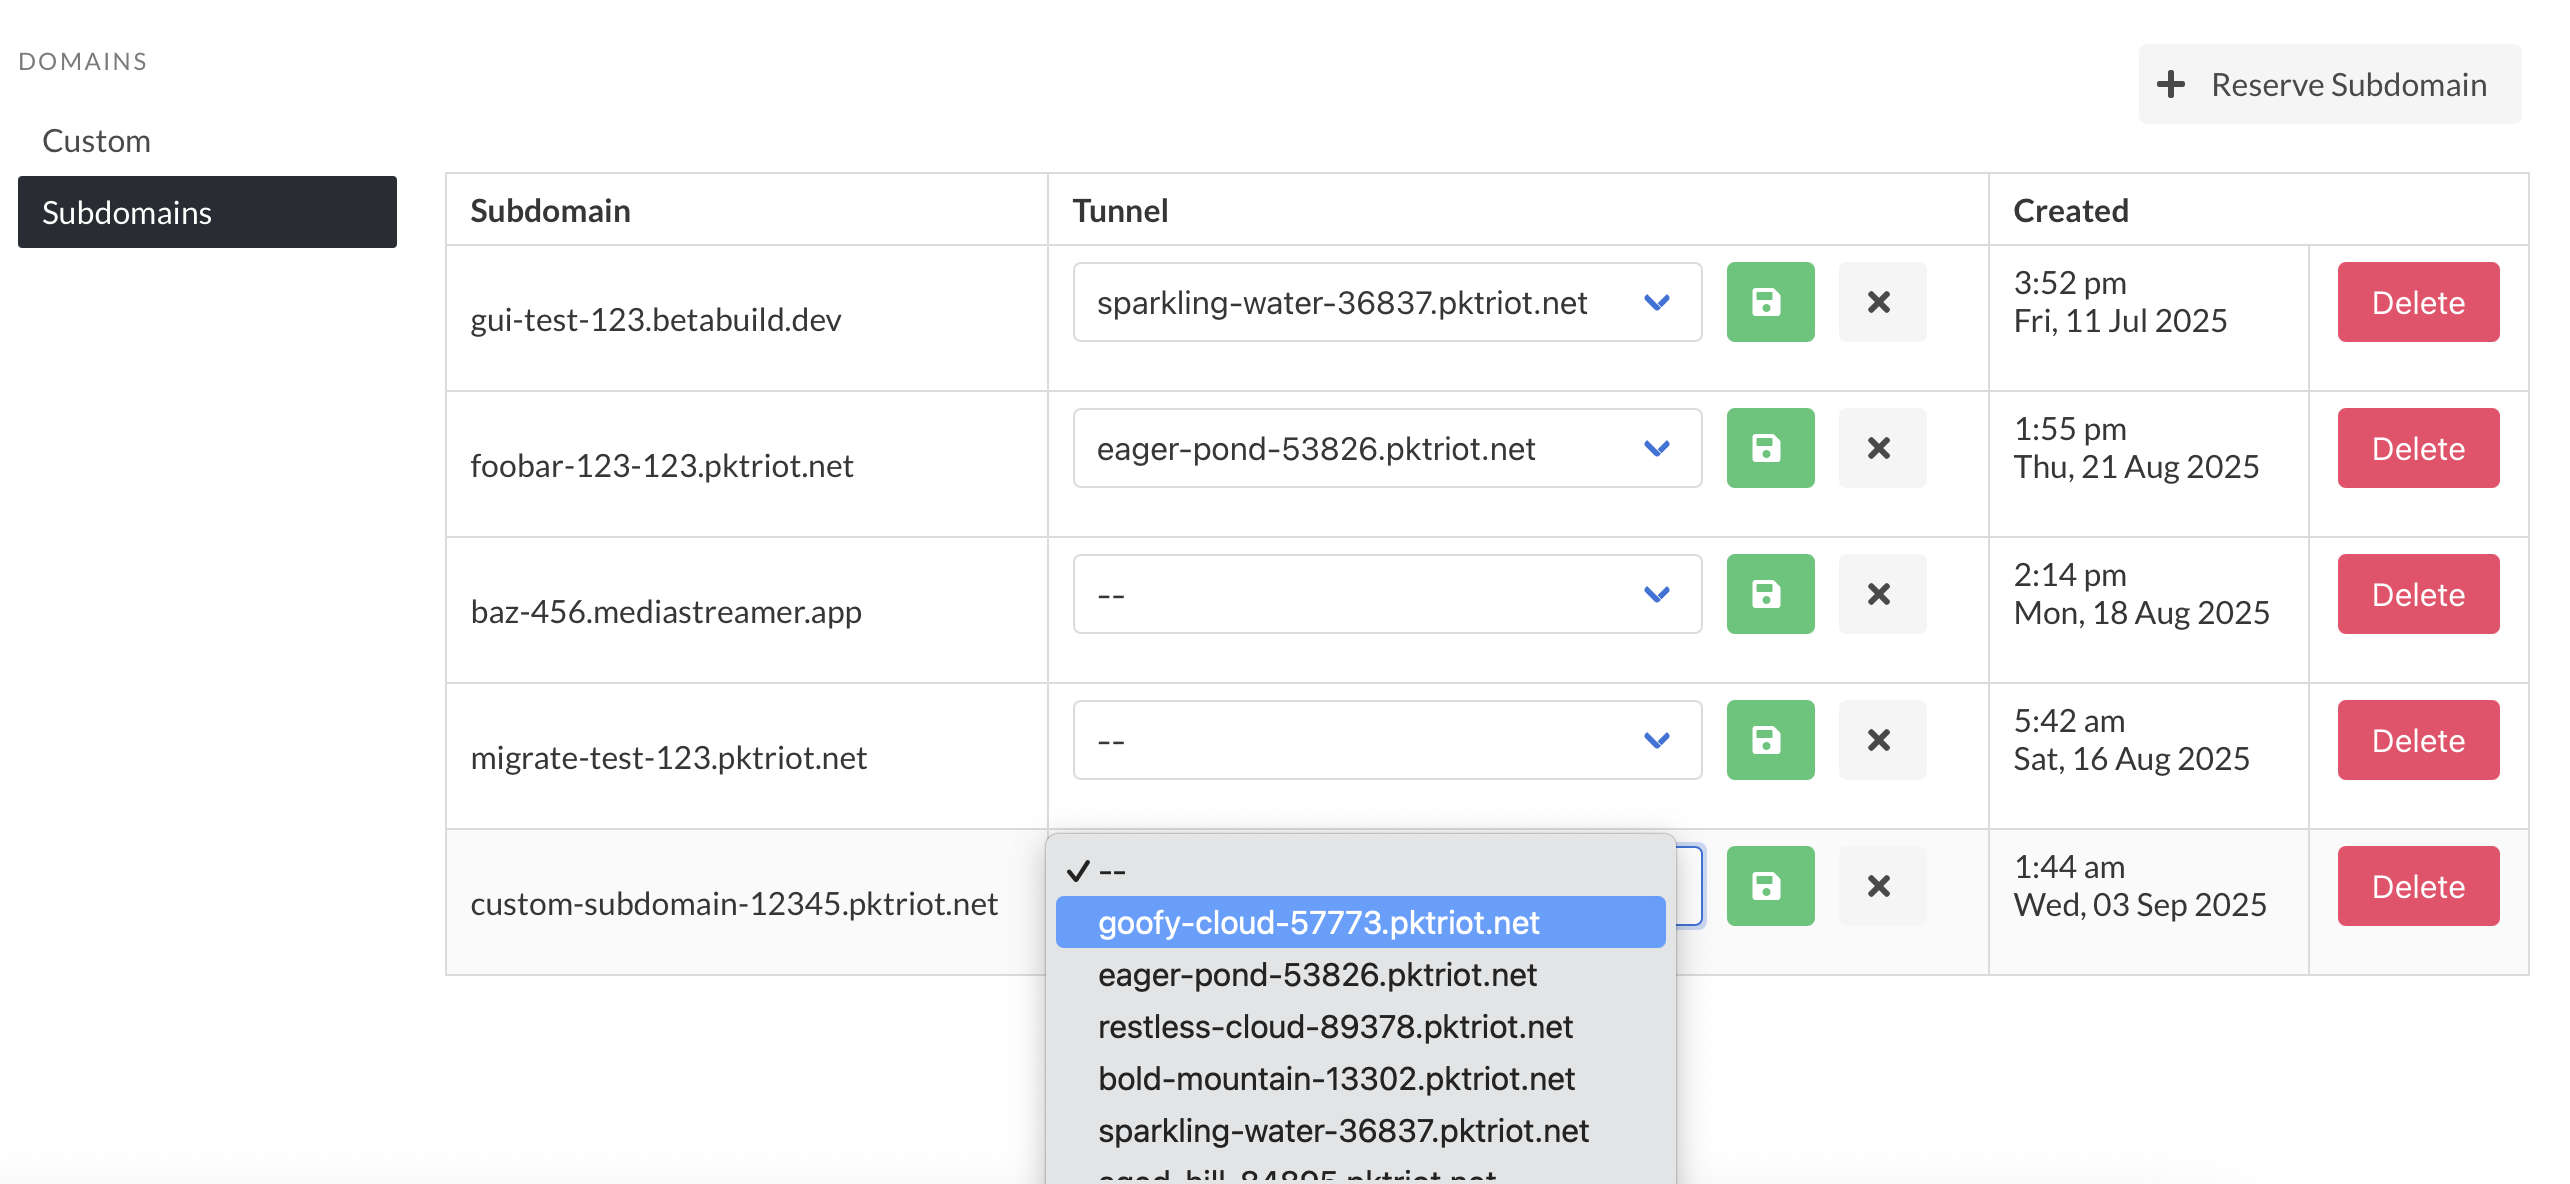
The screenshot below provides an example of all the subdomains reserved and their tunnel assignments.
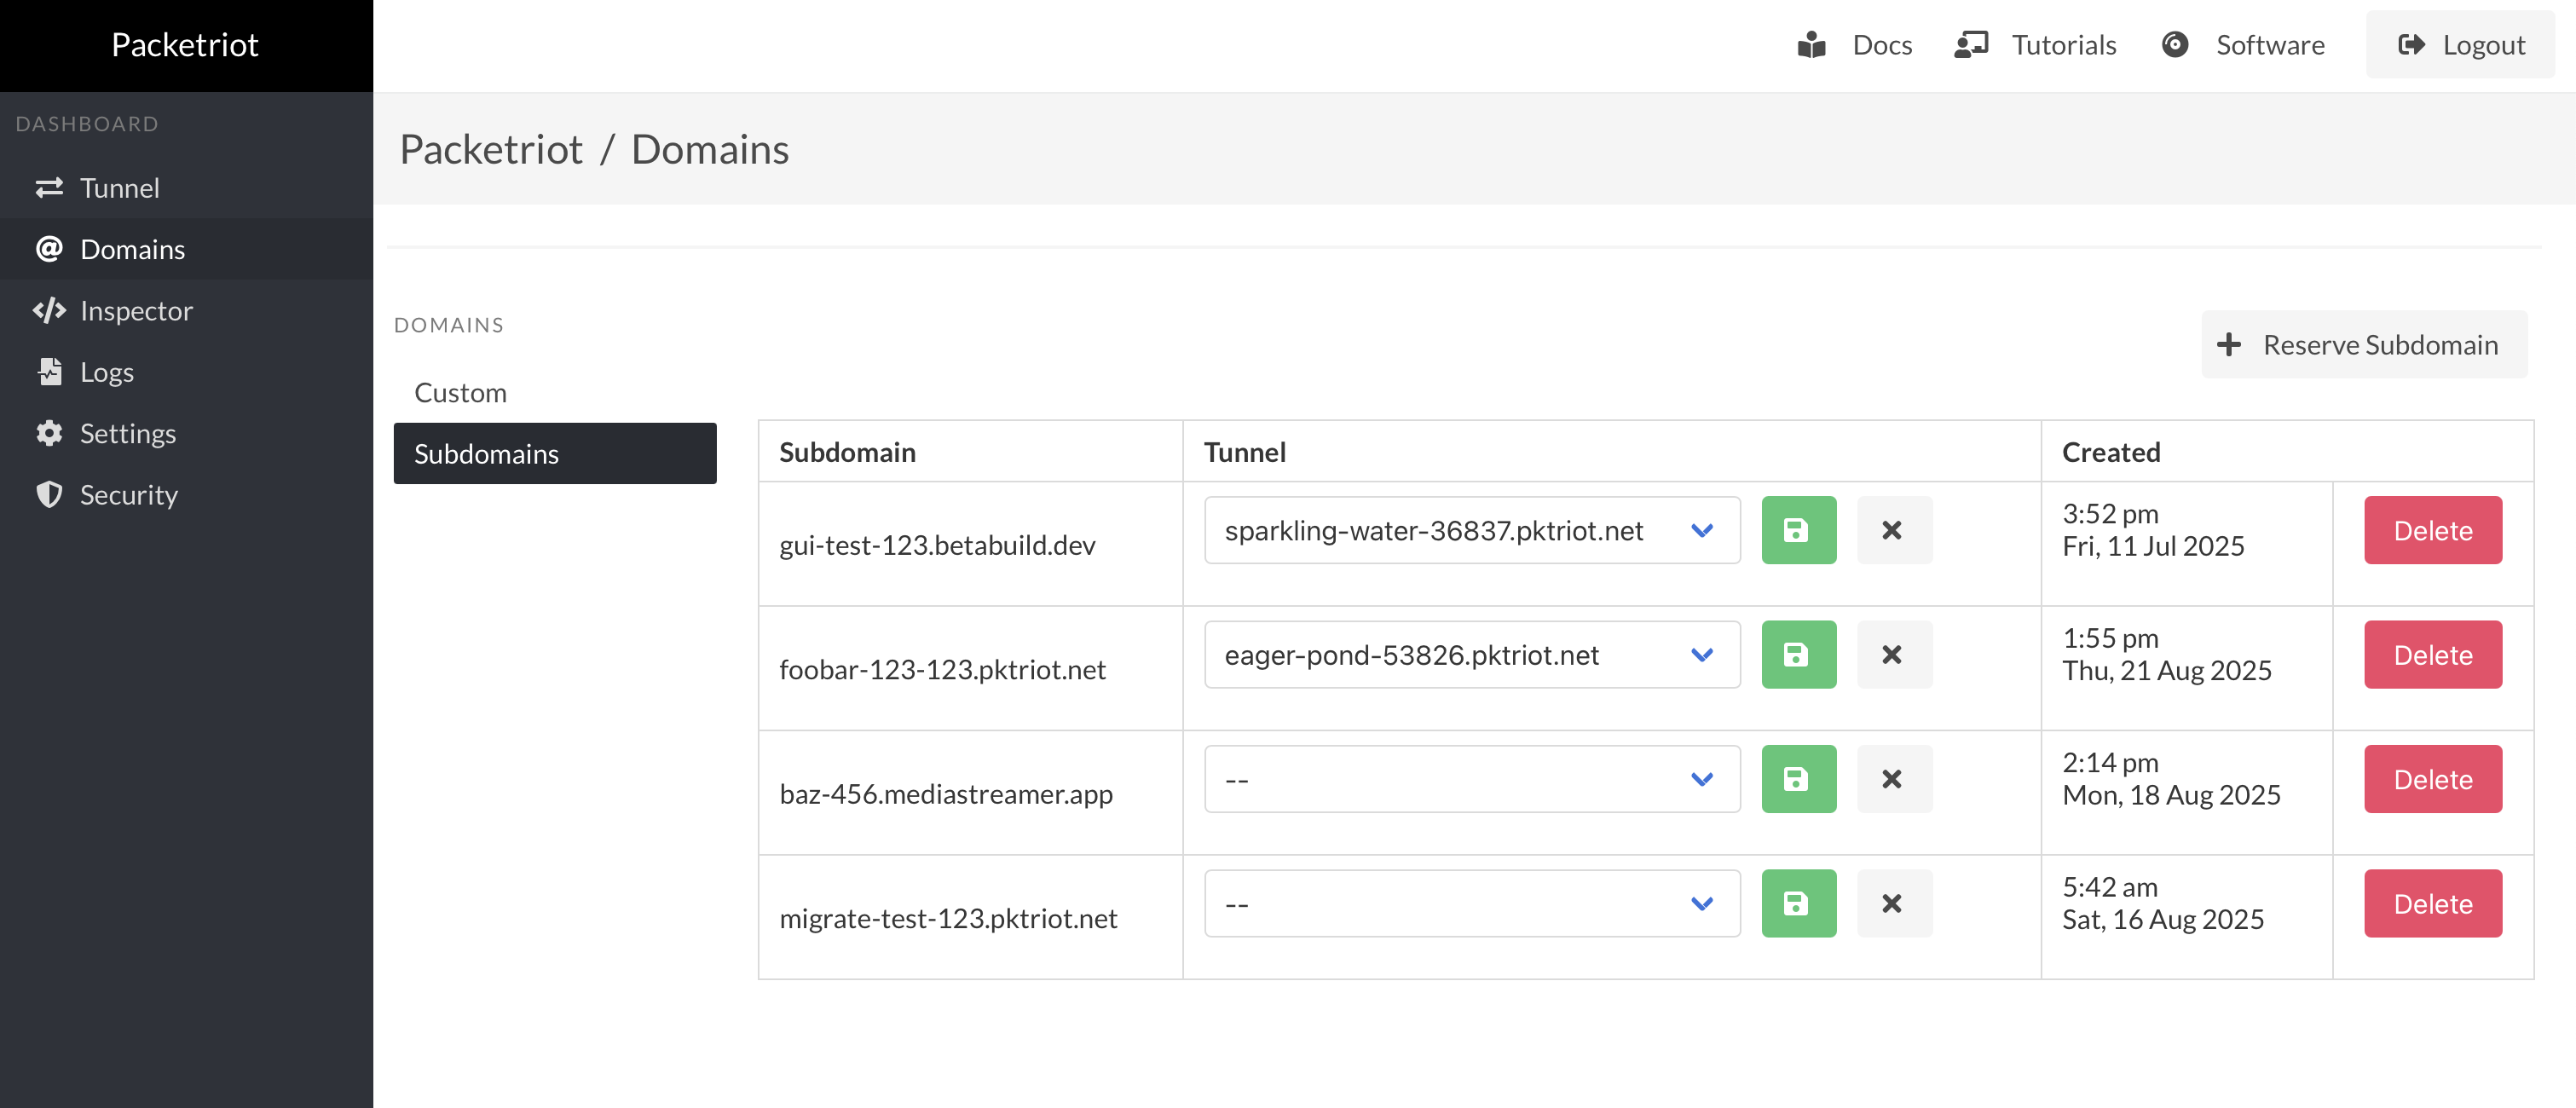
You can reserve new subdomains from the web dashboard as well/
You can assign a reserved subdomain to a tunnel in this page as well, and delete assignments or release the subdomain.
Managing reserved subdomains in the web dashboard makes them a more useful feature, and we hope more subscribers make use of them.
Inspector
We added the inspector back in 2020 and haven't made many updates to it since. It's not a feature requested by many of our users. It made sense to make some minor updates and integrate them into the new web dashboard.
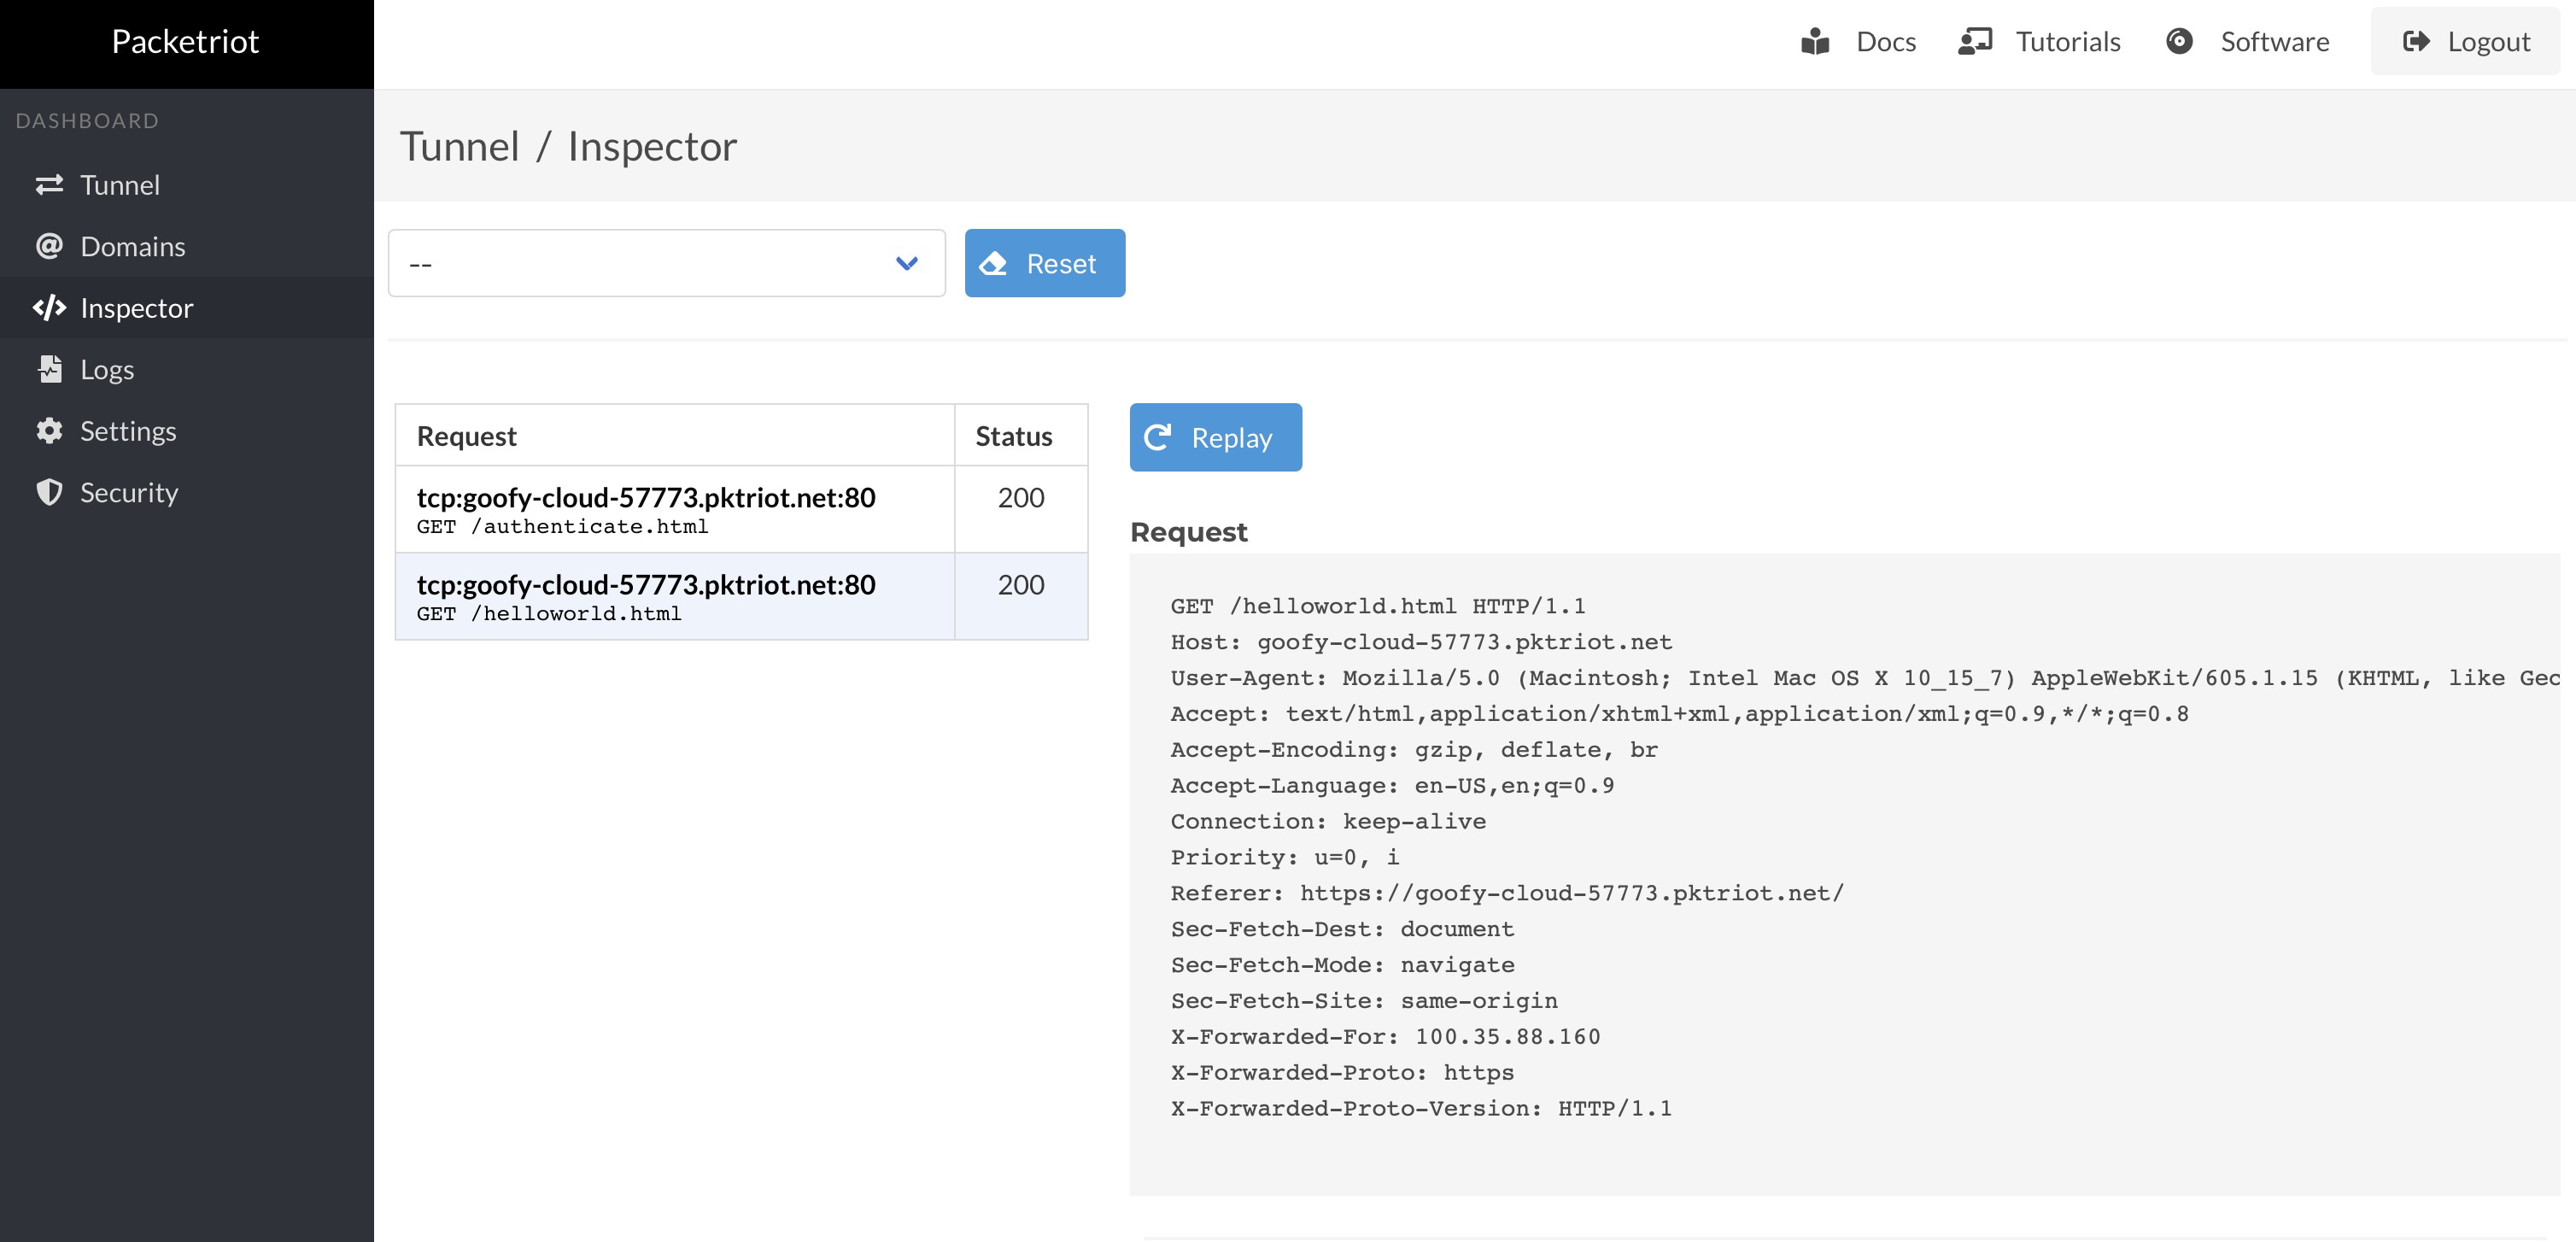
You can enable the inspector by checking off the Inspect box for an HTTP traffic rule.
Settings
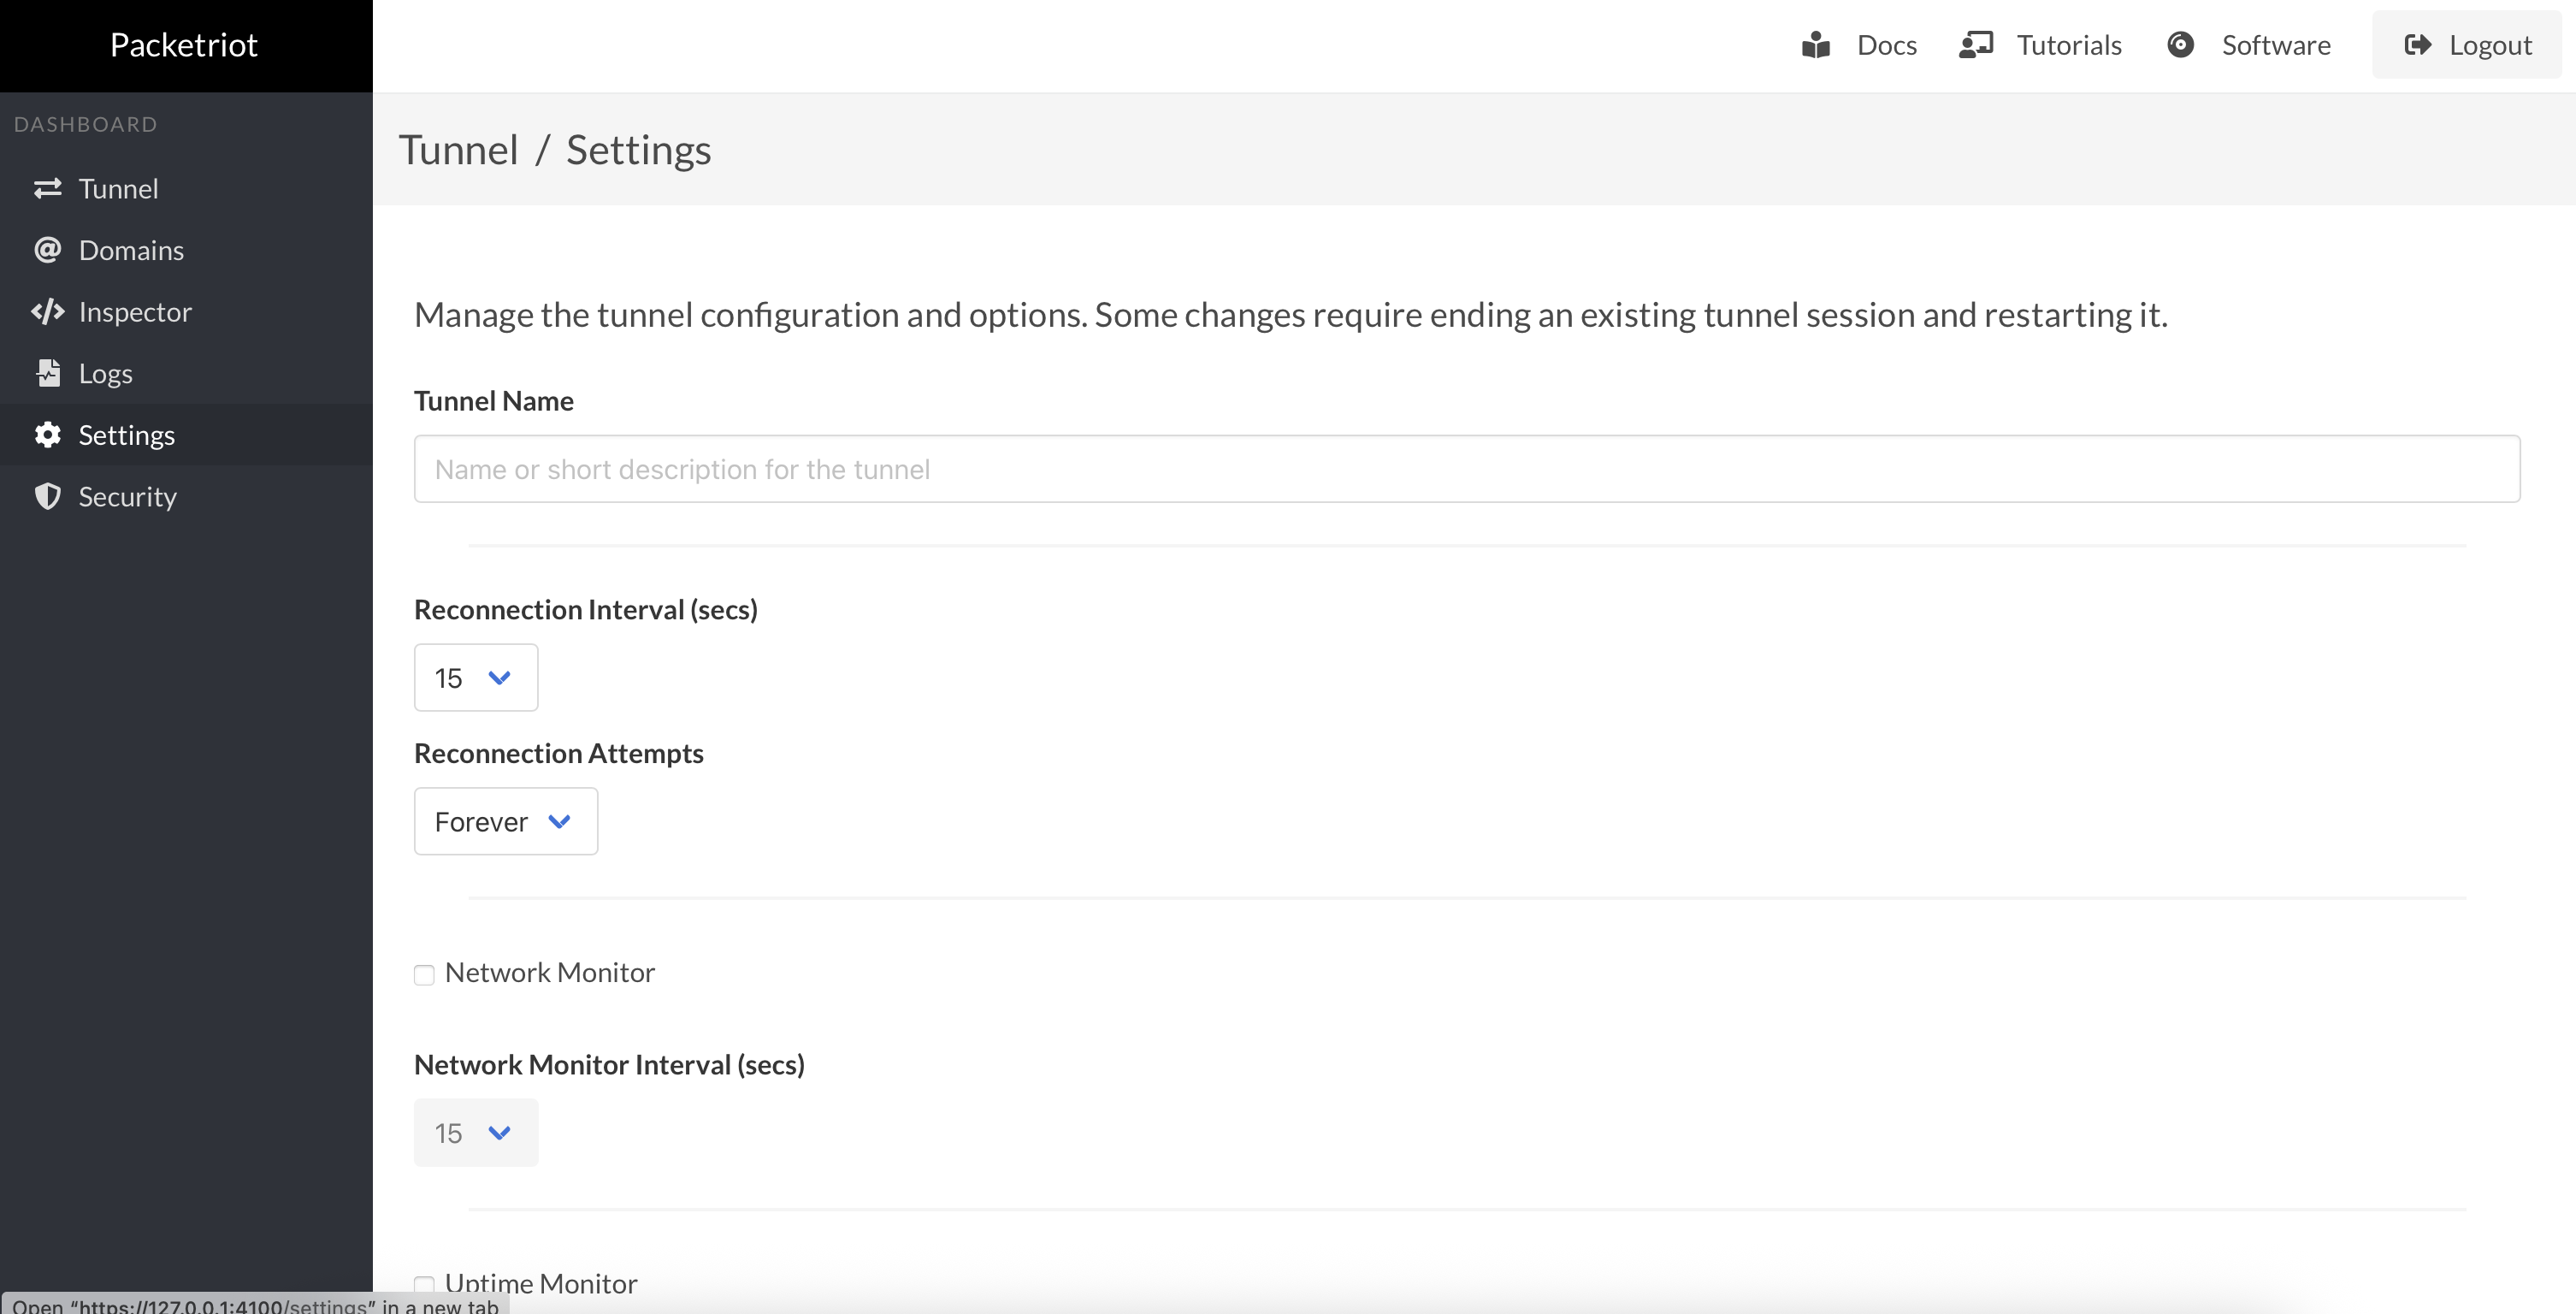
You can now configure all settings for the tunnel in the web dashboard. This includes:
- Changing the tunnel name
- Setting reconnection parameters for the time between attempts to reconnect and the maximum number of attempts to make
- Uptime monitor settings, which enable an uptime monitor that can be used to check if any of the services hosted behind the tunnel can be reached successfully
- Network monitoring checks that determine if the network you're on has changed, and restarts the tunnel when that happens
You can also change the log level too if you want to get more information on what's happening inside the client. We are planning improvements to our logging to make this feature more helpful and less noisy.
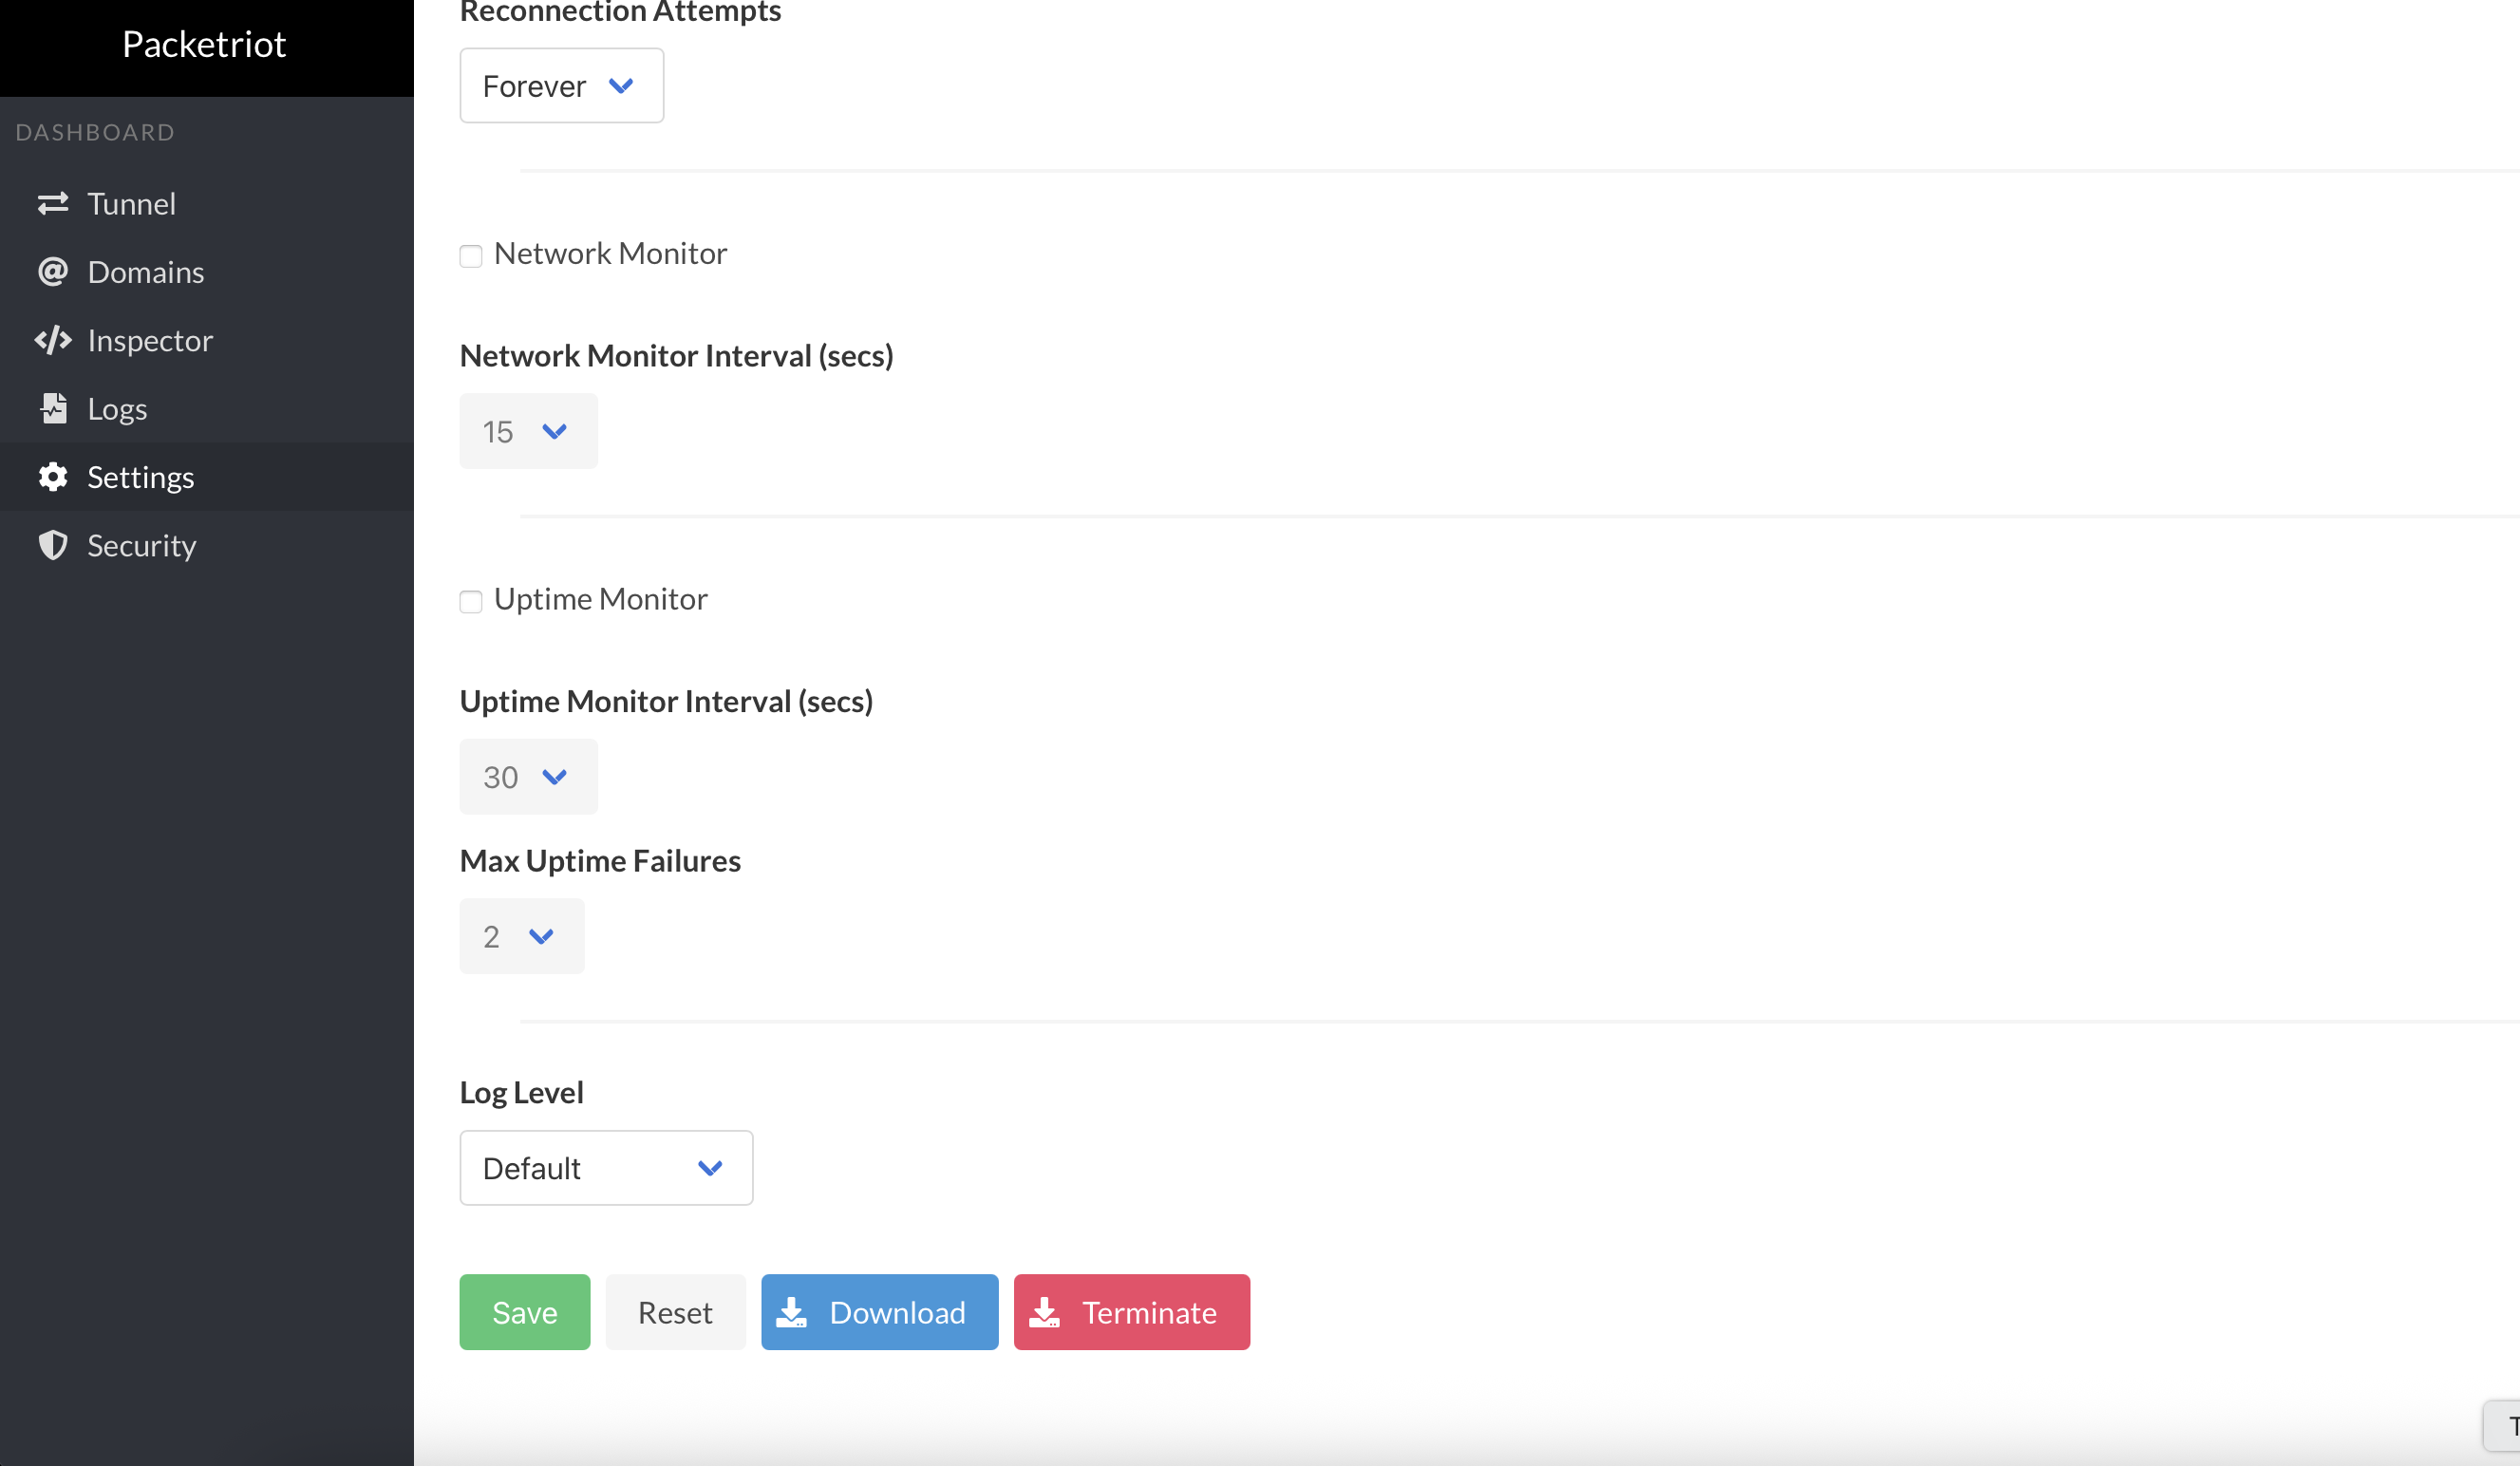
Finally, you can download the tunnel configuration so that you can make backups. You can terminate the tunnel as well, which will reset the client. You don't have to restart pktriot to configure a new tunnel; you'll be returned to the configuration screen right away.
Note, users on the free tier will have to log into Packetriot.com to terminate tunnels. This is a limitation to reduce abuse of our free tier.
Security
The addition of the web dashboard and expanded API required new features from a security perspective. The first is that the web dashboard and API are always served using HTTPS:
- Dashboard
https://127.0.0.1:4100 - Client API
https://127.0.0.1:4100/api/client/v1.0
These endpoints are always printed when the client is run in daemon mode. The next feature was to protect the dashboard with the passphrase and the API with a token (secret). These parameters can be set during the tunnel configuration workflow or later in the Security Settings area of the web dashboard.
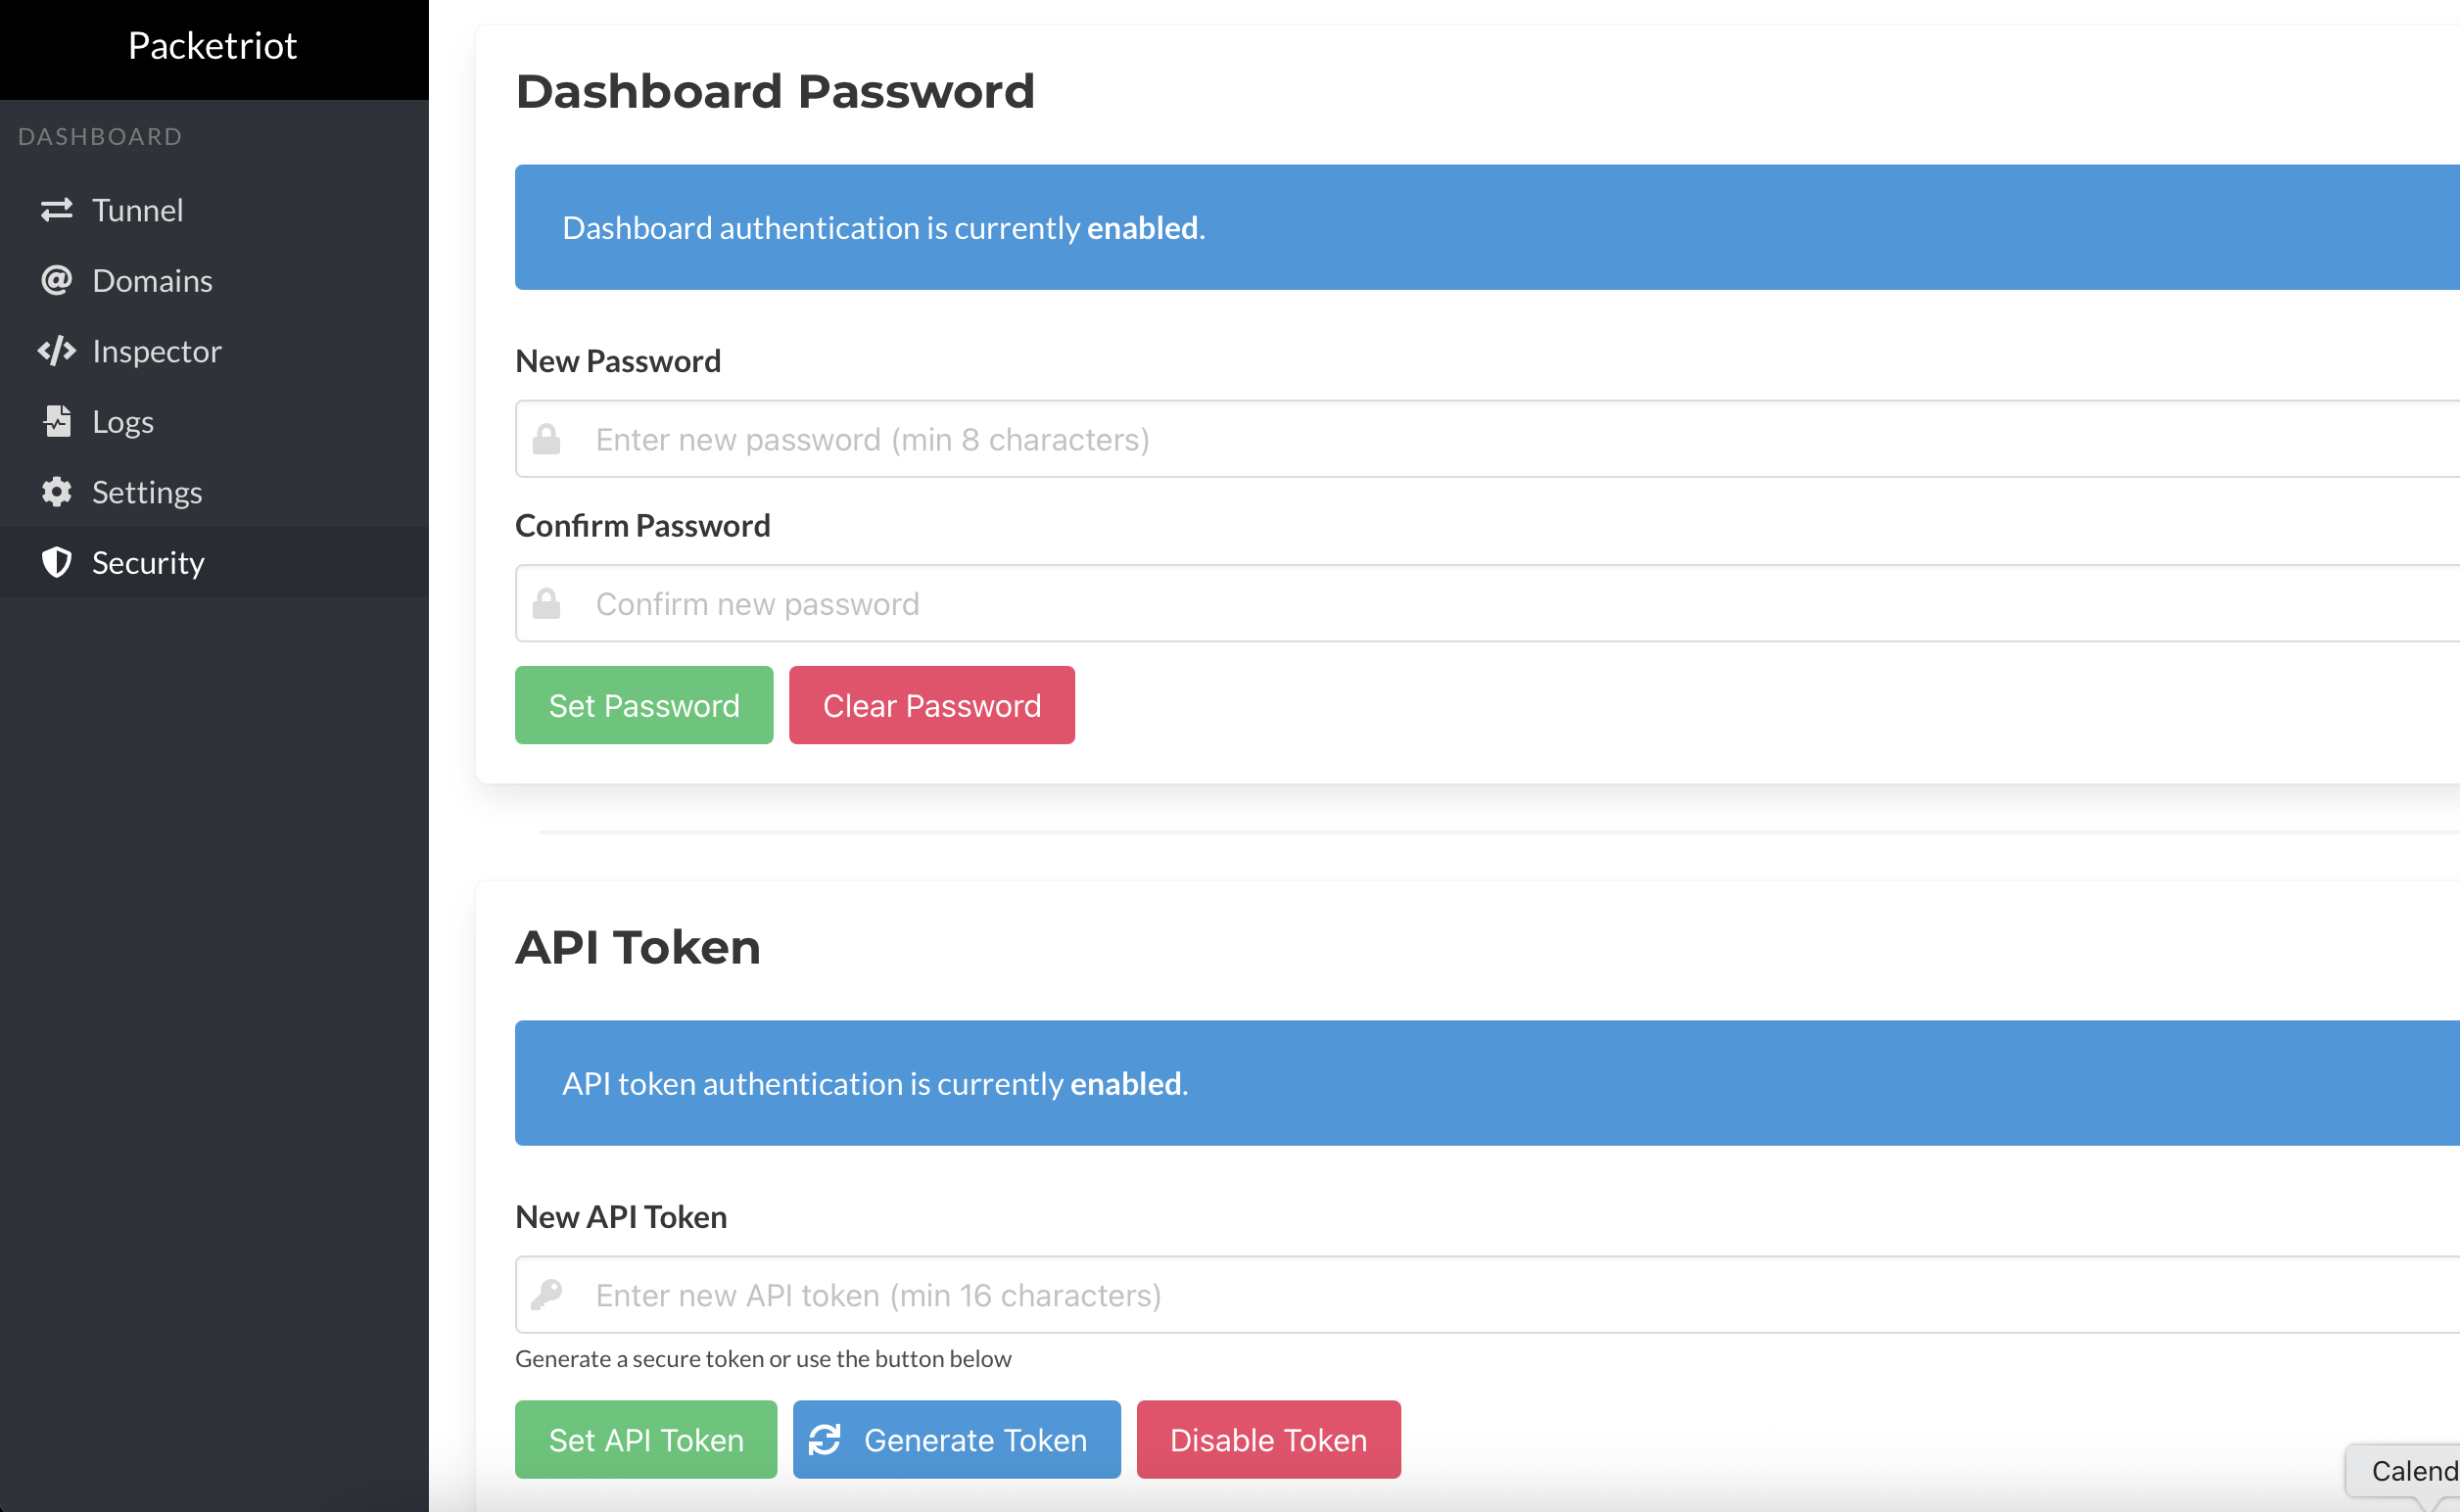
We highly recommend setting up a passphrase for the dashboard and a token for the API if your client is listening on 0.0.0.0 or can be accessed by other hosts, via Docker port mapping or listening on a non-local IP address.
API
Your daemon is setup and running and we've taken a tour of the web-based dashboard to configure and manage tunnels, however, you can perform almost all of these same steps programmatically using the HTTP API.
Once the daemon is running, you can use the API to configure the tunnel and traffic rules. Here are some API endpoints of interest to get your started:
The Packetriot client running in daemon mode is intended to be a constant running service that can be configured, terminated, reconfigured, etc. by an external program. It's perfect for a variety of use-cases and the API, with programmatic configuration, make it simple for a third-party application to configure the client and then provide remote access to software applications or devices, such as:
- Raspberry Pi's
- Point-of-sale systems
- IoT devices
- IP video cameras
And much more!